Midterm Review
Contents
Midterm Review#
from datascience import *
from cs104 import *
import numpy as np
%matplotlib inline
Small Items#
You will not need to use the
interactfunction or think about interactive visualizations on the exam.
Loops#
An Example of a loop that iterates over the values of an array#
# stay_positive(make_array(1,-1,-2,3,4,0)) function should return 3 -> number of positive numbers in an array.
extra_values = make_array(-1,2,3)

def stay_positive(values):
    numbers_positive = 0   # keep a count of how my positive numbers we've seen so far

    for value in values:
        # if my value is positive, increase number of positive numbers
        if value > 0:
            numbers_positive = numbers_positive + 1

    return numbers_positive
stay_positive(make_array(1,-1,-2,3,4,0))
3
An Example to builds an array and returns it#
def track_positives(values):
    positive_values = make_array()
    for value in values:
        # if my value is positive, increase number of positive numbers
        if value > 0:
            positive_values = np.append(positive_values, value)
    return positive_values
track_positives(make_array(1,-1,-2,3,4,0))
array([1., 3., 4.])
An Example of a loop that iterates for a specific number of times.#
def run_trials(trials):
    for i in np.arange(0,trials):
        print(2*i)
n_trials = 10     # how many trials to run
run_trials(n_trials)
0
2
4
6
8
10
12
14
16
18
Group and Pivot#
penguins = Table().read_table('data/penguins.csv')
penguins.sample(5)
| species | island | bill_length_mm | bill_depth_mm | flipper_length_mm | body_mass_g | sex |
|---|---|---|---|---|---|---|
| Adelie | Torgersen | 42 | 20.2 | 190 | 4250 | UNKNOWN |
| Chinstrap | Dream | 42.5 | 16.7 | 187 | 3350 | FEMALE |
| Gentoo | Biscoe | 49.8 | 16.8 | 230 | 5700 | MALE |
| Gentoo | Biscoe | 48.7 | 15.1 | 222 | 5350 | MALE |
| Gentoo | Biscoe | 50 | 15.2 | 218 | 5700 | MALE |
group divides the rows into groups according to the values stored in a categorical variable.
penguins.group('species')
| species | count |
|---|---|
| Adelie | 151 |
| Chinstrap | 68 |
| Gentoo | 123 |
With only one parameter, we get a count of how many rows are in each group. Pass in a second parameter that is an aggregation function to summarize the numerical columns in the table.
penguins.group('species', np.mean)
| species | island mean | bill_length_mm mean | bill_depth_mm mean | flipper_length_mm mean | body_mass_g mean | sex mean |
|---|---|---|---|---|---|---|
| Adelie | 38.7914 | 18.3464 | 189.954 | 3700.66 | ||
| Chinstrap | 48.8338 | 18.4206 | 195.824 | 3733.09 | ||
| Gentoo | 47.5049 | 14.9821 | 217.187 | 5076.02 |
We can also group by more than one column by passing in an array of the columns to group by.
penguins.group(make_array('species', 'island'), max)
| species | island | bill_length_mm max | bill_depth_mm max | flipper_length_mm max | body_mass_g max | sex max |
|---|---|---|---|---|---|---|
| Adelie | Biscoe | 45.6 | 21.1 | 203 | 4775 | MALE |
| Adelie | Dream | 44.1 | 21.2 | 208 | 4650 | UNKNOWN |
| Adelie | Torgersen | 46 | 21.5 | 210 | 4700 | UNKNOWN |
| Chinstrap | Dream | 58 | 20.8 | 212 | 4800 | MALE |
| Gentoo | Biscoe | 59.6 | 17.3 | 231 | 6300 | UNKNOWN |
pivot creates a 2-dimensional matrix by grouping according to two columns. If only those columns are provided, we get counts of how many rows fall into each row/col combination.
penguins.pivot('species', 'island')
| island | Adelie | Chinstrap | Gentoo |
|---|---|---|---|
| Biscoe | 44 | 0 | 123 |
| Dream | 56 | 68 | 0 |
| Torgersen | 51 | 0 | 0 |
Or you can pass a third column and a way to summarize that column’s values for each group:
penguins.pivot('species', 'island', 'bill_length_mm', max)
| island | Adelie | Chinstrap | Gentoo |
|---|---|---|---|
| Biscoe | 45.6 | 0 | 59.6 |
| Dream | 44.1 | 58 | 0 |
| Torgersen | 46 | 0 | 0 |
We use pivot instead of group to present data in a more accessible way, or to prepare for additional data manipulation or analyses.
Functions#
Check out our lecture slides on Functions for a more complete discussion of how function definitions work, but here’s an example showing the major parts:
All functions start with def, the number of the function, and then the list of parameter names.
The body of the function is indented and contains the instructions to run when the function is called.
The
returnstatement is used to give a value back to the caller.
def count_odd_values(values):
    num_odd_values = 0
    for value in values:
        if value % 2 != 0:
            num_odd_values = num_odd_values + 1
    return num_odd_values
count_odd_values(extra_values)
2
Histograms#
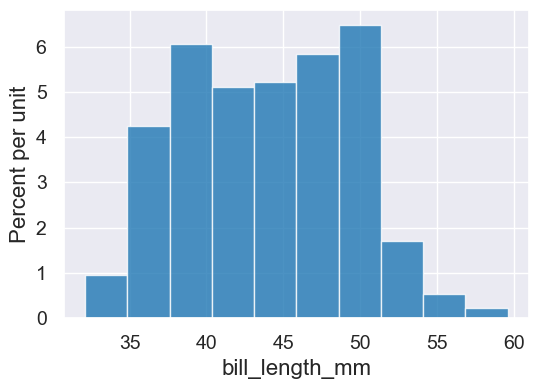
Histograms show the distribution of values taken on by a variable. They often convey more information than just looking at the min, max, and mean. The area of each bar is proportional to the percent of data values falling with them. That percentage is computed for a bar by multiplying the width of the bar by its height.
penguins.hist('bill_length_mm')
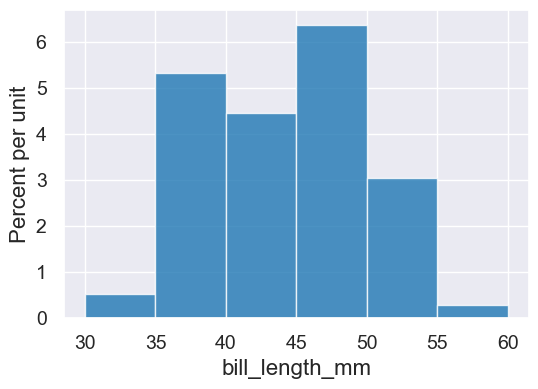
We can adjust the bins to make the plot easier to interpret. One way is to give an array of values that will be used as the cutoffs between the bins:
cutoffs = np.arange(30,65,5)
cutoffs
array([30, 35, 40, 45, 50, 55, 60])
penguins.hist('bill_length_mm', bins=cutoffs)
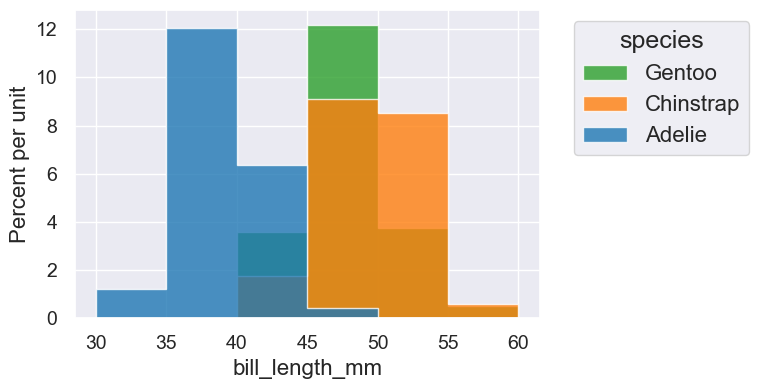
We can also make an overlaid histogram:
penguins.hist('bill_length_mm', bins=cutoffs, group='species')