Python Library Reference
Python Library Reference#
In the left column, all names refer to functions, methods, examples of arguments to a function or method, or examples of an object we might call the method on. For example,
tblrefers to a table,arrayrefers to an array,stris a string, andnumrefers to a number.array.item(0)is an example call for the methoditem, and in that example,arrayis the name previously given to some array.Click on any row to see detailed examples.
Library Sections
- Table Functions and Methods
- String Methods
- Array Functions and Methods
- Table.where(...) Predicates
- Other Functions
- Plot Customization and Annotation
Table Functions and Methods
| Name | Ch | Description | Parameters | Output | ||||||||||||||||||||||||||||||||||||||||||||||||||||||||||||||||||||||||||||||||||||||||||||||||||||||||||||||||||||||||||||||||||
|---|---|---|---|---|---|---|---|---|---|---|---|---|---|---|---|---|---|---|---|---|---|---|---|---|---|---|---|---|---|---|---|---|---|---|---|---|---|---|---|---|---|---|---|---|---|---|---|---|---|---|---|---|---|---|---|---|---|---|---|---|---|---|---|---|---|---|---|---|---|---|---|---|---|---|---|---|---|---|---|---|---|---|---|---|---|---|---|---|---|---|---|---|---|---|---|---|---|---|---|---|---|---|---|---|---|---|---|---|---|---|---|---|---|---|---|---|---|---|---|---|---|---|---|---|---|---|---|---|---|---|---|---|---|---|
|
Create an empty table, usually to extend with data |
None |
An empty Table |
|||||||||||||||||||||||||||||||||||||||||||||||||||||||||||||||||||||||||||||||||||||||||||||||||||||||||||||||||||||||||||||||||||
|
||||||||||||||||||||||||||||||||||||||||||||||||||||||||||||||||||||||||||||||||||||||||||||||||||||||||||||||||||||||||||||||||||||||
|
Create a table from a data file |
string: the name of the file |
Table with the contents of the data file |
|||||||||||||||||||||||||||||||||||||||||||||||||||||||||||||||||||||||||||||||||||||||||||||||||||||||||||||||||||||||||||||||||||
|
||||||||||||||||||||||||||||||||||||||||||||||||||||||||||||||||||||||||||||||||||||||||||||||||||||||||||||||||||||||||||||||||||||||
|
A table with an additional or replaced column or columns. |
|
Table: a copy of the original Table with the new columns added |
|||||||||||||||||||||||||||||||||||||||||||||||||||||||||||||||||||||||||||||||||||||||||||||||||||||||||||||||||||||||||||||||||||
|
||||||||||||||||||||||||||||||||||||||||||||||||||||||||||||||||||||||||||||||||||||||||||||||||||||||||||||||||||||||||||||||||||||||
|
The values of a column (an array) |
string: the column name |
array: the values in that column |
|||||||||||||||||||||||||||||||||||||||||||||||||||||||||||||||||||||||||||||||||||||||||||||||||||||||||||||||||||||||||||||||||||
|
||||||||||||||||||||||||||||||||||||||||||||||||||||||||||||||||||||||||||||||||||||||||||||||||||||||||||||||||||||||||||||||||||||||
|
Compute the number of rows in a table |
None |
int: the number of rows in the table |
|||||||||||||||||||||||||||||||||||||||||||||||||||||||||||||||||||||||||||||||||||||||||||||||||||||||||||||||||||||||||||||||||||
|
||||||||||||||||||||||||||||||||||||||||||||||||||||||||||||||||||||||||||||||||||||||||||||||||||||||||||||||||||||||||||||||||||||||
|
Compute the number of columns in a table |
None |
int: the number of columns in the table |
|||||||||||||||||||||||||||||||||||||||||||||||||||||||||||||||||||||||||||||||||||||||||||||||||||||||||||||||||||||||||||||||||||
|
||||||||||||||||||||||||||||||||||||||||||||||||||||||||||||||||||||||||||||||||||||||||||||||||||||||||||||||||||||||||||||||||||||||
|
Lists the column labels in a table |
None |
array: the names of each column (as strings) in the table |
|||||||||||||||||||||||||||||||||||||||||||||||||||||||||||||||||||||||||||||||||||||||||||||||||||||||||||||||||||||||||||||||||||
|
||||||||||||||||||||||||||||||||||||||||||||||||||||||||||||||||||||||||||||||||||||||||||||||||||||||||||||||||||||||||||||||||||||||
|
Create a copy of a table with only some of the columns. |
string: column name(s) |
Table with the selected columns |
|||||||||||||||||||||||||||||||||||||||||||||||||||||||||||||||||||||||||||||||||||||||||||||||||||||||||||||||||||||||||||||||||||
|
||||||||||||||||||||||||||||||||||||||||||||||||||||||||||||||||||||||||||||||||||||||||||||||||||||||||||||||||||||||||||||||||||||||
|
Create a copy of a table without some of the columns. |
string: column name(s) |
Table without the selected columns |
|||||||||||||||||||||||||||||||||||||||||||||||||||||||||||||||||||||||||||||||||||||||||||||||||||||||||||||||||||||||||||||||||||
|
||||||||||||||||||||||||||||||||||||||||||||||||||||||||||||||||||||||||||||||||||||||||||||||||||||||||||||||||||||||||||||||||||||||
|
Creates a new table, changing the column name specified by the old label to the new label, and leaves the original table unchanged. |
|
Table: a new Table |
|||||||||||||||||||||||||||||||||||||||||||||||||||||||||||||||||||||||||||||||||||||||||||||||||||||||||||||||||||||||||||||||||||
|
||||||||||||||||||||||||||||||||||||||||||||||||||||||||||||||||||||||||||||||||||||||||||||||||||||||||||||||||||||||||||||||||||||||
|
Display |
(Optional) int: number of rows you want to display |
None: displays a table with |
|||||||||||||||||||||||||||||||||||||||||||||||||||||||||||||||||||||||||||||||||||||||||||||||||||||||||||||||||||||||||||||||||||
|
||||||||||||||||||||||||||||||||||||||||||||||||||||||||||||||||||||||||||||||||||||||||||||||||||||||||||||||||||||||||||||||||||||||
|
Create a copy of a table sorted by the values in a column. There are two optional parameters:
|
|
Table: a copy of the original with the column sorted |
|||||||||||||||||||||||||||||||||||||||||||||||||||||||||||||||||||||||||||||||||||||||||||||||||||||||||||||||||||||||||||||||||||
|
||||||||||||||||||||||||||||||||||||||||||||||||||||||||||||||||||||||||||||||||||||||||||||||||||||||||||||||||||||||||||||||||||||||
|
Create a copy of a table with only the rows that match some predicate . See |
|
Table: a copy of the original table with only the rows that match the predicate |
|||||||||||||||||||||||||||||||||||||||||||||||||||||||||||||||||||||||||||||||||||||||||||||||||||||||||||||||||||||||||||||||||||
|
||||||||||||||||||||||||||||||||||||||||||||||||||||||||||||||||||||||||||||||||||||||||||||||||||||||||||||||||||||||||||||||||||||||
|
A table with only the rows at the given indices. |
array of ints: the indices of the rows to be included in the Table OR int: the index of the row to be included |
Table: a copy of the original table with only the rows at the given indices |
|||||||||||||||||||||||||||||||||||||||||||||||||||||||||||||||||||||||||||||||||||||||||||||||||||||||||||||||||||||||||||||||||||
|
||||||||||||||||||||||||||||||||||||||||||||||||||||||||||||||||||||||||||||||||||||||||||||||||||||||||||||||||||||||||||||||||||||||
|
A table with only the rows with valid values of the appropriate type for each specified column. |
|
Table: a copy of the original Table containing only the rows that match the type criteria for the specified columns. |
|||||||||||||||||||||||||||||||||||||||||||||||||||||||||||||||||||||||||||||||||||||||||||||||||||||||||||||||||||||||||||||||||||
|
||||||||||||||||||||||||||||||||||||||||||||||||||||||||||||||||||||||||||||||||||||||||||||||||||||||||||||||||||||||||||||||||||||||
|
A table with only the rows with invalid values of the appropriate type in one or more of the specified columns. |
|
Table: a copy of the original Table containing only the rows that do not match the type criteria for the specified columns. |
|||||||||||||||||||||||||||||||||||||||||||||||||||||||||||||||||||||||||||||||||||||||||||||||||||||||||||||||||||||||||||||||||||
|
||||||||||||||||||||||||||||||||||||||||||||||||||||||||||||||||||||||||||||||||||||||||||||||||||||||||||||||||||||||||||||||||||||||
|
Create a copy of the table where all values equal to |
|
Table: a copy of the original Table with the old value replaced with new. |
|||||||||||||||||||||||||||||||||||||||||||||||||||||||||||||||||||||||||||||||||||||||||||||||||||||||||||||||||||||||||||||||||||
|
||||||||||||||||||||||||||||||||||||||||||||||||||||||||||||||||||||||||||||||||||||||||||||||||||||||||||||||||||||||||||||||||||||||
|
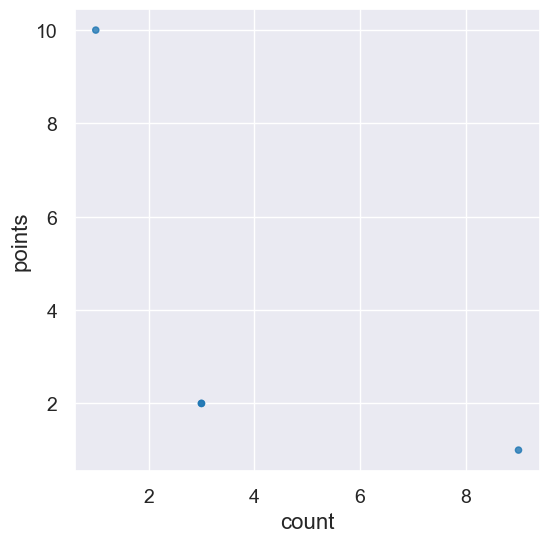
Draws a scatter plot consisting of one point for each row of the table. Note that |
|
None: draws a scatter plot |
|||||||||||||||||||||||||||||||||||||||||||||||||||||||||||||||||||||||||||||||||||||||||||||||||||||||||||||||||||||||||||||||||||
|
||||||||||||||||||||||||||||||||||||||||||||||||||||||||||||||||||||||||||||||||||||||||||||||||||||||||||||||||||||||||||||||||||||||
|
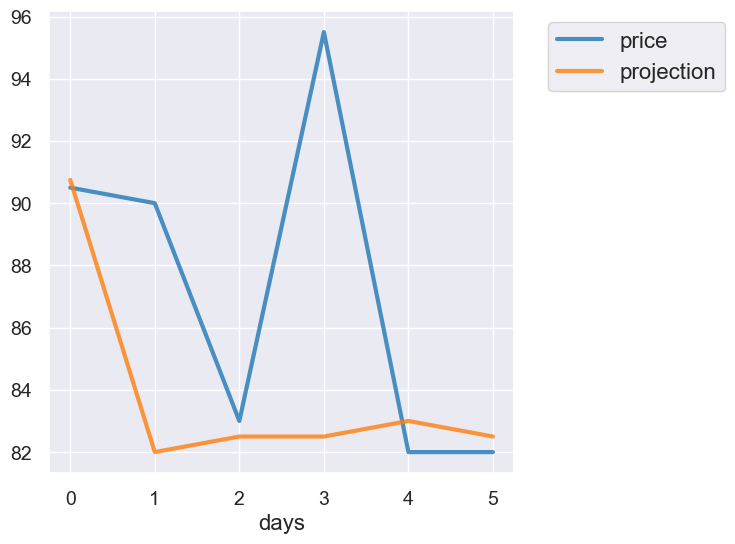
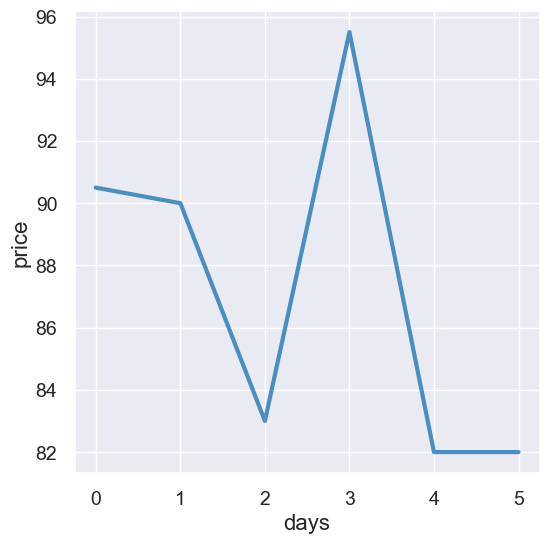
Draw a line graph consisting of one point for each row of the table. If you only specify one column, it will plot the rest of the columns on the y-axis as different colored lines. |
|
None: draws a line graph |
|||||||||||||||||||||||||||||||||||||||||||||||||||||||||||||||||||||||||||||||||||||||||||||||||||||||||||||||||||||||||||||||||||
|
||||||||||||||||||||||||||||||||||||||||||||||||||||||||||||||||||||||||||||||||||||||||||||||||||||||||||||||||||||||||||||||||||||||
|
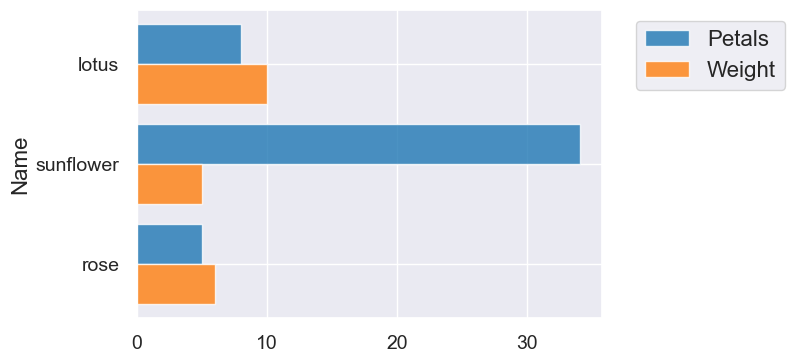
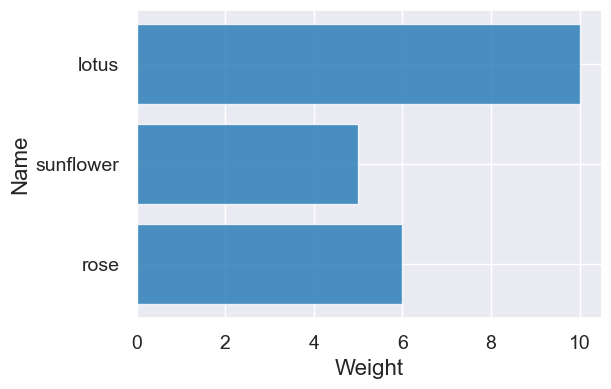
Displays a bar chart with bars for each category in a column, with height proportional to the corresponding frequency. values argument unnecessary if table has only a column of categories and a column of values. |
|
None: draws a bar chart |
|||||||||||||||||||||||||||||||||||||||||||||||||||||||||||||||||||||||||||||||||||||||||||||||||||||||||||||||||||||||||||||||||||
|
||||||||||||||||||||||||||||||||||||||||||||||||||||||||||||||||||||||||||||||||||||||||||||||||||||||||||||||||||||||||||||||||||||||
|
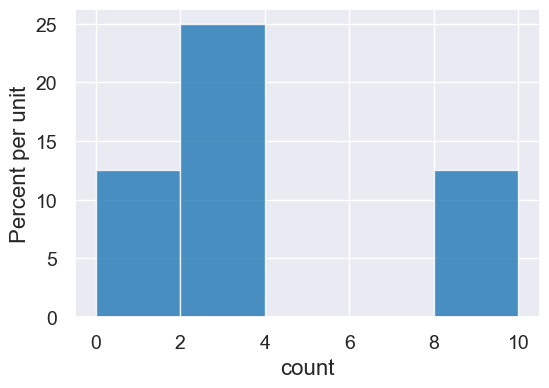
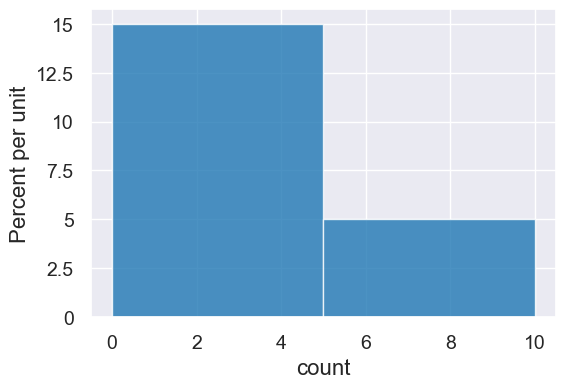
Generates a histogram of the numerical values in a column. |
|
None: draws a histogram |
|||||||||||||||||||||||||||||||||||||||||||||||||||||||||||||||||||||||||||||||||||||||||||||||||||||||||||||||||||||||||||||||||||
|
||||||||||||||||||||||||||||||||||||||||||||||||||||||||||||||||||||||||||||||||||||||||||||||||||||||||||||||||||||||||||||||||||||||
|
Groups values into intervals, known as bins. Results in a two-column table that contains the number of rows in each bin. The first column lists the left endpoints of the bins, except in the last row. If the |
|
Table: a new Table |
|||||||||||||||||||||||||||||||||||||||||||||||||||||||||||||||||||||||||||||||||||||||||||||||||||||||||||||||||||||||||||||||||||
|
||||||||||||||||||||||||||||||||||||||||||||||||||||||||||||||||||||||||||||||||||||||||||||||||||||||||||||||||||||||||||||||||||||||
|
Returns an array of values resulting from applying a function to each item in a column. |
|
array: contains an element for each value in the original column after applying the function to it |
|||||||||||||||||||||||||||||||||||||||||||||||||||||||||||||||||||||||||||||||||||||||||||||||||||||||||||||||||||||||||||||||||||
|
||||||||||||||||||||||||||||||||||||||||||||||||||||||||||||||||||||||||||||||||||||||||||||||||||||||||||||||||||||||||||||||||||||||
|
Group rows by unique values or combinations of values in a column(s). Multiple columns must be entered in array or list form. Other values aggregated by count (default) or optional argument |
|
Table: a new Table |
|||||||||||||||||||||||||||||||||||||||||||||||||||||||||||||||||||||||||||||||||||||||||||||||||||||||||||||||||||||||||||||||||||
|
||||||||||||||||||||||||||||||||||||||||||||||||||||||||||||||||||||||||||||||||||||||||||||||||||||||||||||||||||||||||||||||||||||||
|
A pivot table where each unique value in |
|
Table: a new Table |
|||||||||||||||||||||||||||||||||||||||||||||||||||||||||||||||||||||||||||||||||||||||||||||||||||||||||||||||||||||||||||||||||||
|
||||||||||||||||||||||||||||||||||||||||||||||||||||||||||||||||||||||||||||||||||||||||||||||||||||||||||||||||||||||||||||||||||||||
|
Generate a table with the columns of tblA and tblB, containing rows for all values of a column that appear in both tables. Default |
|
Table: a new Table |
|||||||||||||||||||||||||||||||||||||||||||||||||||||||||||||||||||||||||||||||||||||||||||||||||||||||||||||||||||||||||||||||||||
|
||||||||||||||||||||||||||||||||||||||||||||||||||||||||||||||||||||||||||||||||||||||||||||||||||||||||||||||||||||||||||||||||||||||
|
A new table where |
|
Table: a new Table with |
|||||||||||||||||||||||||||||||||||||||||||||||||||||||||||||||||||||||||||||||||||||||||||||||||||||||||||||||||||||||||||||||||||
|
||||||||||||||||||||||||||||||||||||||||||||||||||||||||||||||||||||||||||||||||||||||||||||||||||||||||||||||||||||||||||||||||||||||
|
Accesses the row of a table by taking the index of the row as its argument. Note that rows are in general not arrays, as their elements can be of different types. However, you can use |
int: row index |
Row object with the values of the row and labels of the corresponding columns |
|||||||||||||||||||||||||||||||||||||||||||||||||||||||||||||||||||||||||||||||||||||||||||||||||||||||||||||||||||||||||||||||||||
|
||||||||||||||||||||||||||||||||||||||||||||||||||||||||||||||||||||||||||||||||||||||||||||||||||||||||||||||||||||||||||||||||||||||
|
N/A |
Can use to access all of the rows of a table. |
None |
Rows object made up of all rows as individual row objects |
||||||||||||||||||||||||||||||||||||||||||||||||||||||||||||||||||||||||||||||||||||||||||||||||||||||||||||||||||||||||||||||||||
|
||||||||||||||||||||||||||||||||||||||||||||||||||||||||||||||||||||||||||||||||||||||||||||||||||||||||||||||||||||||||||||||||||||||
String Methods
| Name | Ch | Description | Parameters | Output | ||||||||||||
|---|---|---|---|---|---|---|---|---|---|---|---|---|---|---|---|---|
|
Splits the string ( |
string: the text used to separate parts of the string |
A list of strings |
|||||||||||||
|
||||||||||||||||
|
Combines each element of |
array: the array to turn into a string |
A new string |
|||||||||||||
|
||||||||||||||||
|
Replaces each occurrence of |
|
A new string |
|||||||||||||
|
||||||||||||||||
Array Functions and Methods
In the examples in the left column, np refers to the NumPy module, as usual.
| Name | Ch | Description | Parameters | Output | ||||||||||||||||||
|---|---|---|---|---|---|---|---|---|---|---|---|---|---|---|---|---|---|---|---|---|---|---|
|
Makes a numpy array with the values passed in |
The values to use |
A new array |
|||||||||||||||||||
|
||||||||||||||||||||||
|
Returns the maximum value of an array |
array: the values to use |
An element from |
|||||||||||||||||||
|
||||||||||||||||||||||
|
Returns the minimum value of an array |
array: the values to use |
An element from |
|||||||||||||||||||
|
||||||||||||||||||||||
|
Returns the sum of the values in an array |
array: the values to use |
An total of |
|||||||||||||||||||
|
||||||||||||||||||||||
|
Take the absolute value of number or each number in an array. |
number or array: the value(s) to use |
A number or array |
|||||||||||||||||||
|
||||||||||||||||||||||
|
Round number or array of numbers to the nearest integer. |
number or array: the value(s) to use |
A number or array |
|||||||||||||||||||
|
||||||||||||||||||||||
|
Returns the length (number of elements) of an array |
array: the values to use |
An int |
|||||||||||||||||||
|
||||||||||||||||||||||
|
Returns the mean value of an array |
array: the values to use |
A number |
|||||||||||||||||||
|
||||||||||||||||||||||
|
Given an |
array: the values to use |
An array |
|||||||||||||||||||
|
||||||||||||||||||||||
|
Returns an array with the square root of each element |
array: the values to use |
A number |
|||||||||||||||||||
|
||||||||||||||||||||||
|
An array of numbers starting with |
|
A new array |
|||||||||||||||||||
|
||||||||||||||||||||||
|
Returns the i-th item in an array (remember Python indices start at 0!) |
int: the index of the item |
An item from |
|||||||||||||||||||
|
||||||||||||||||||||||
|
Picks one (by default) or some number |
|
A value or array |
|||||||||||||||||||
|
||||||||||||||||||||||
|
Returns the number of non-zero (or |
array: The values to use |
An int |
|||||||||||||||||||
|
||||||||||||||||||||||
|
Returns a copy of the input array with |
|
A new array |
|||||||||||||||||||
|
||||||||||||||||||||||
|
Returns the corresponding percentile of an array. |
|
A value |
|||||||||||||||||||
|
||||||||||||||||||||||
|
Returns the standard deviation of an array |
array: the values to use |
A number |
|||||||||||||||||||
|
||||||||||||||||||||||
Table.where(...) Predicates
Any of these predicates can be negated by adding not_ in front of them, e.g. are.not_equal_to(Z) or are.not_containing(S).
| Name | Ch | Description | ||||||||||||||||||||||||||||||||||||||||||||
|---|---|---|---|---|---|---|---|---|---|---|---|---|---|---|---|---|---|---|---|---|---|---|---|---|---|---|---|---|---|---|---|---|---|---|---|---|---|---|---|---|---|---|---|---|---|---|
|
Equal to |
|||||||||||||||||||||||||||||||||||||||||||||
|
||||||||||||||||||||||||||||||||||||||||||||||
|
Not equal to |
|||||||||||||||||||||||||||||||||||||||||||||
|
||||||||||||||||||||||||||||||||||||||||||||||
|
Greater than |
|||||||||||||||||||||||||||||||||||||||||||||
|
||||||||||||||||||||||||||||||||||||||||||||||
|
Greater than or equal to |
|||||||||||||||||||||||||||||||||||||||||||||
|
||||||||||||||||||||||||||||||||||||||||||||||
|
Less than |
|||||||||||||||||||||||||||||||||||||||||||||
|
||||||||||||||||||||||||||||||||||||||||||||||
|
Less than or equal to |
|||||||||||||||||||||||||||||||||||||||||||||
|
||||||||||||||||||||||||||||||||||||||||||||||
|
Greater than or equal to |
|||||||||||||||||||||||||||||||||||||||||||||
|
||||||||||||||||||||||||||||||||||||||||||||||
|
Greater than or equal to |
|||||||||||||||||||||||||||||||||||||||||||||
|
||||||||||||||||||||||||||||||||||||||||||||||
|
Greater than |
|||||||||||||||||||||||||||||||||||||||||||||
|
||||||||||||||||||||||||||||||||||||||||||||||
|
Is a substring of |
|||||||||||||||||||||||||||||||||||||||||||||
|
||||||||||||||||||||||||||||||||||||||||||||||
|
Contains the string |
|||||||||||||||||||||||||||||||||||||||||||||
|
||||||||||||||||||||||||||||||||||||||||||||||
Other Functions
| Name | Ch | Description | Parameters | Output | ||||||||||||
|---|---|---|---|---|---|---|---|---|---|---|---|---|---|---|---|---|
|
|
condition : the condition to ensure is true |
None: prints a message if the condition is false |
|||||||||||||
|
||||||||||||||||
|
|
|
array : each item corresponds to the proportion of times that corresponding item was sampled from model_proportions in sample_size draws, should sum to 1 |
|||||||||||||
|
||||||||||||||||
|
Create an interactive visualization for the function
|
|
None |
|||||||||||||
|
||||||||||||||||
|
Returns an array of values such that if each value in the array was passed into |
function : name of a function that will be minimized. |
array : An array in which each element corresponds to an argument that minimizes the output of the function. Values in the array are listed based on the order they are passed into the function; the first element in the array is also going to be the first value passed into the function. |
|||||||||||||
|
||||||||||||||||
Plot Customization and Annotation
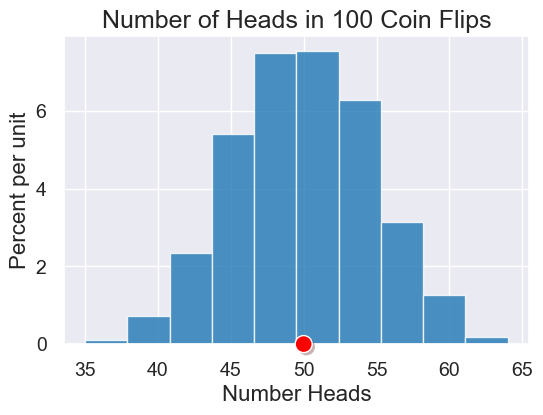
The table methods hist, plot, scatter, and barh all return a plot that you can use to
customize or annotate your figure in various ways using the following methods.
For example, the following code changes the title and adds a red do to plot on the right.
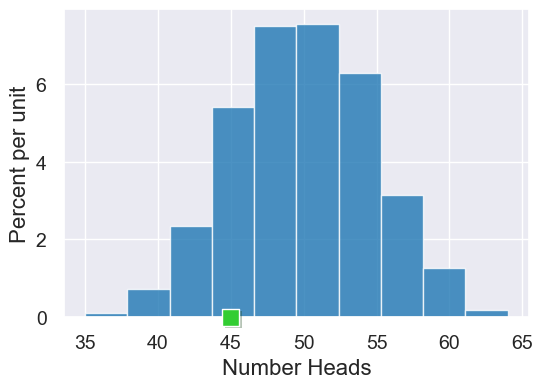
plot = heads_count.hist()
plot.set_title('Number of Heads in 100 Coin Flips')
plot.dot(50)
| Name | Description | |||||||||||||||||||||
|---|---|---|---|---|---|---|---|---|---|---|---|---|---|---|---|---|---|---|---|---|---|---|
|
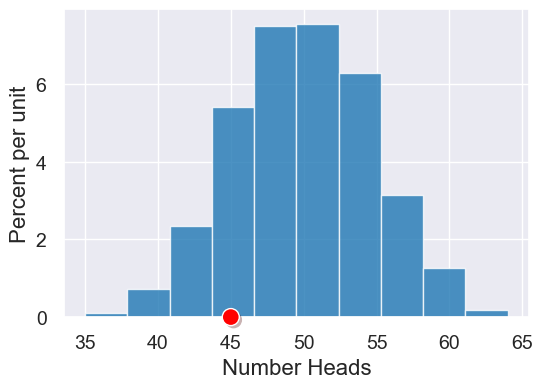
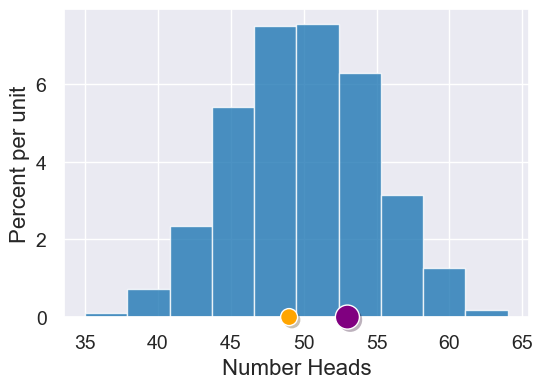
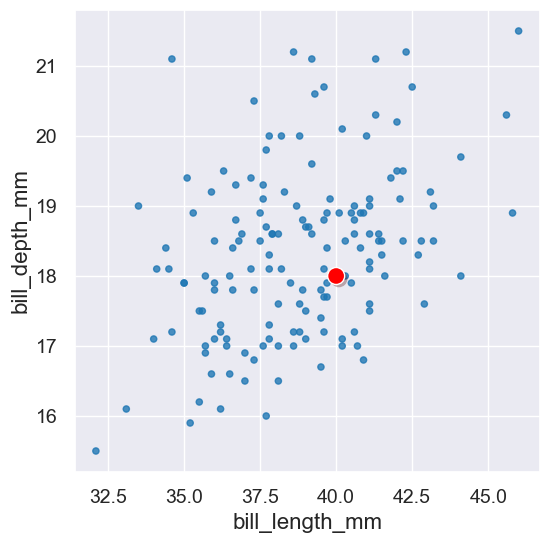
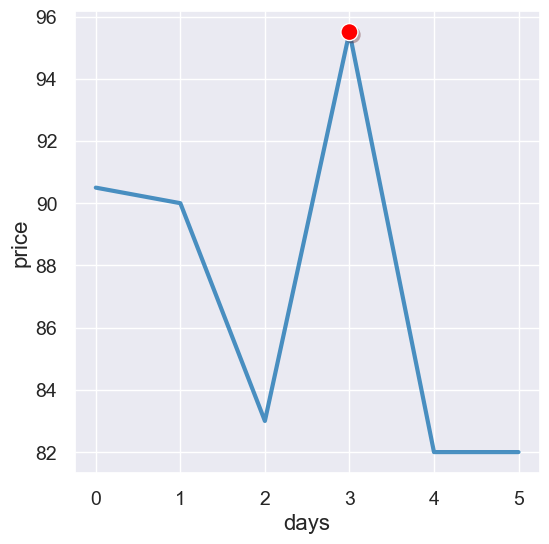
Places a circle marker on a scatter plot, line plot, or histogram. If only |
|||||||||||||||||||||
|
||||||||||||||||||||||
|
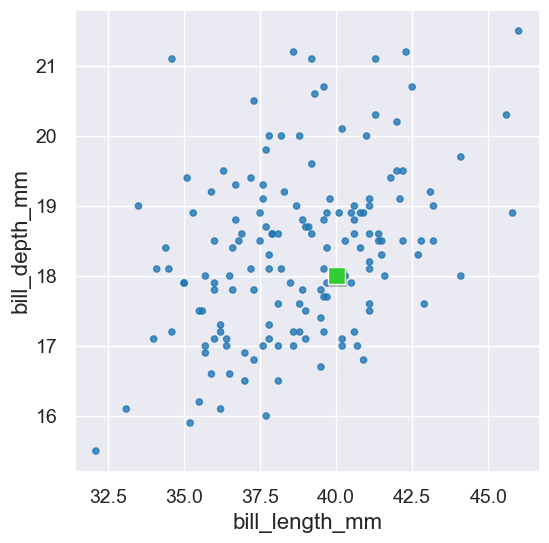
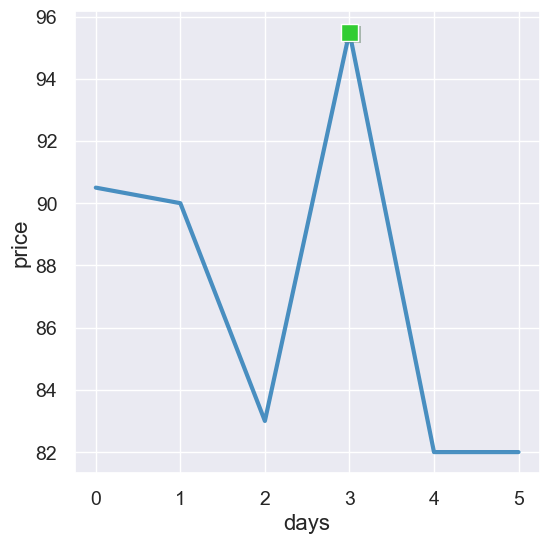
Places a square marker on a scatter plot, line plot, or histogram. If only |
|||||||||||||||||||||
|
||||||||||||||||||||||
|
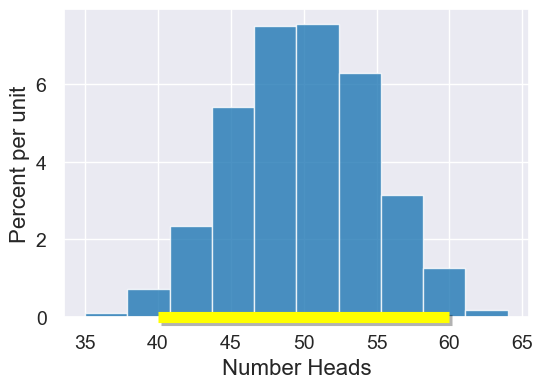
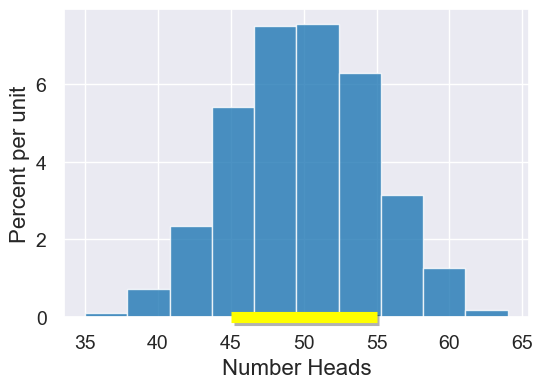
Marks an interval on the x-axis with a yellow bar. Call either |
|||||||||||||||||||||
|
||||||||||||||||||||||
|
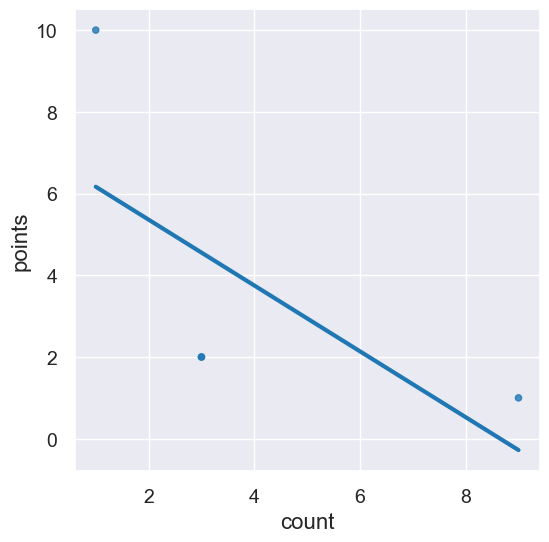
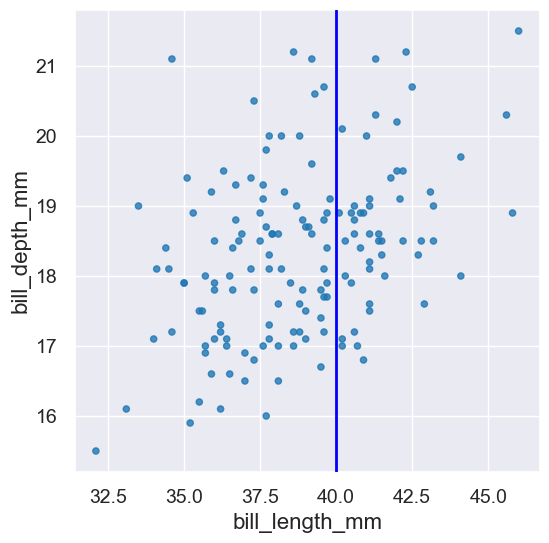
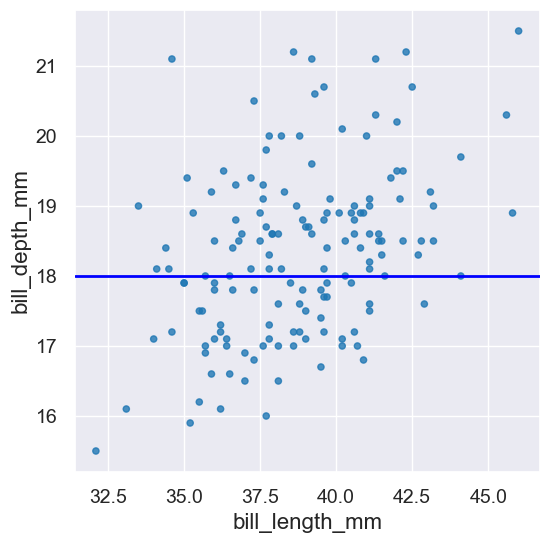
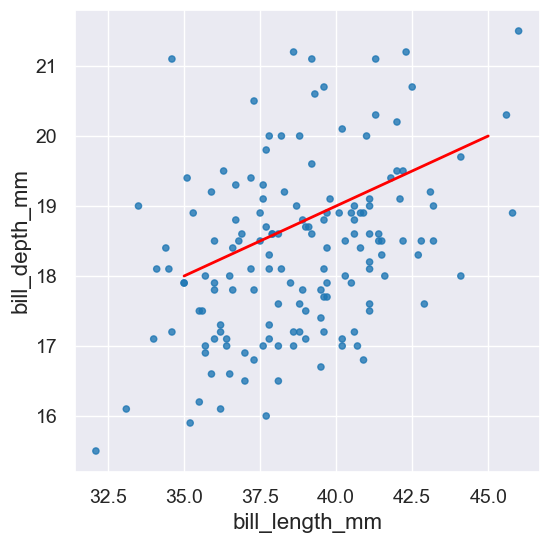
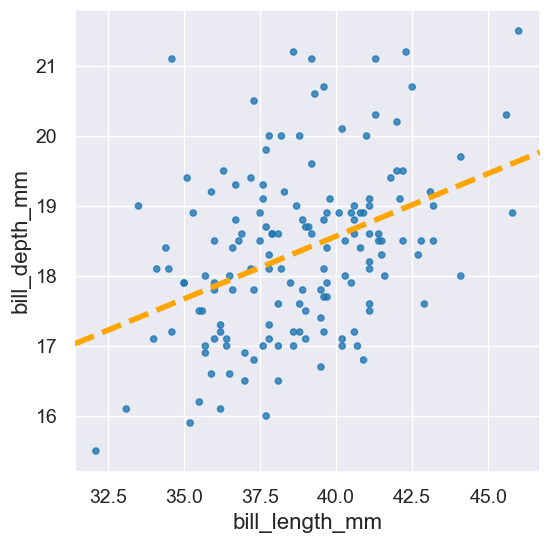
Adds a line to a plot. You may describe the line to draw with several parameters:
Optional arguments |
|||||||||||||||||||||
|
||||||||||||||||||||||
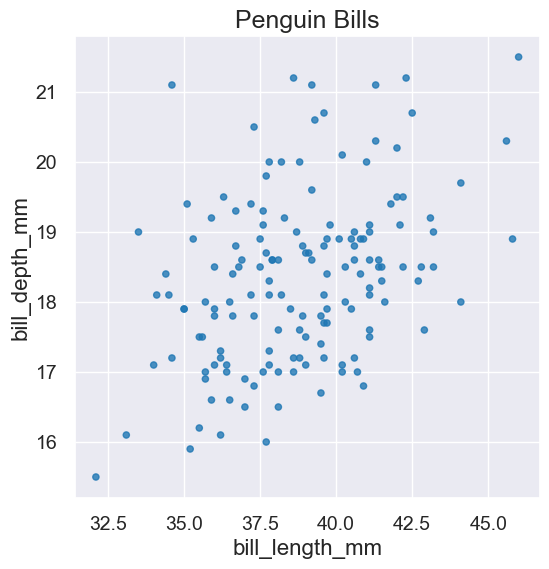
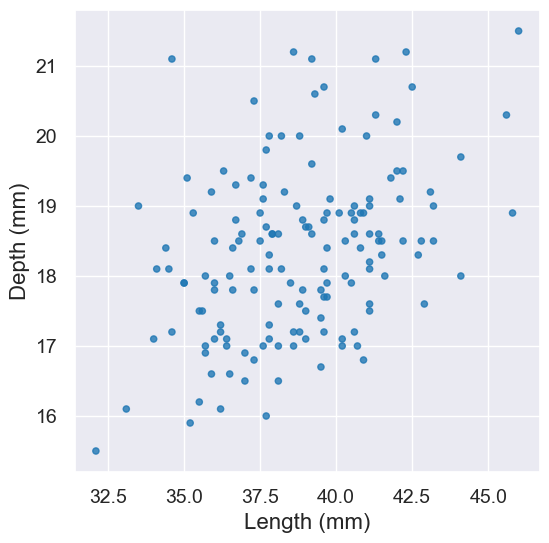
|
Set the title or the the x or y axes to a new label. |
|||||||||||||||||||||
|
||||||||||||||||||||||
|
Set the range of values displayed along the x or y axis. |
|||||||||||||||||||||
|
||||||||||||||||||||||

Based on a reference page written by Nishant Kheterpal and Jessica Hu.