Interpreting Confidence Intervals
Contents
Interpreting Confidence Intervals#
from datascience import *
from cs104 import *
import numpy as np
%matplotlib inline
1. Caffeine Experiment#
Let’s load a table of (fake) data for this experiment.
This has the results for the number of words recalled from a list before and after taking caffeine as well as the difference for every student.
caffeine = Table().read_table("data/caffeine.csv")
caffeine.show(5)
| Student | Pretest | Posttest | Difference |
|---|---|---|---|
| 0 | 27 | 12 | -15 |
| 1 | 10 | 8 | -2 |
| 2 | 10 | 30 | 20 |
| 3 | 4 | 5 | 1 |
| 4 | 12 | 35 | 23 |
... (35 rows omitted)
print("Sample size =", caffeine.num_rows)
Sample size = 40
diff_array = caffeine.column("Difference")
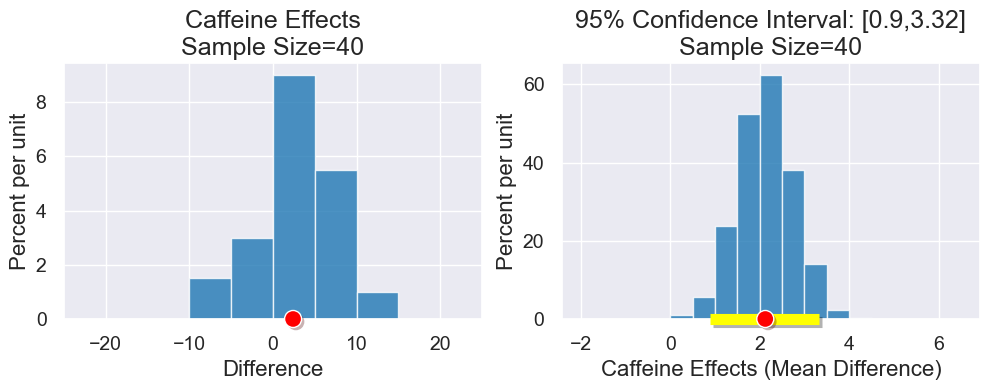
Let’s use the mean difference between post-test and pre-test in our sample as our estimate for our population parameter.
effect = np.mean(diff_array)
print("Caffeine Effect (Mean difference in the sample) = ", effect)
Caffeine Effect (Mean difference in the sample) = 2.375
Ok! It’s positive so maybe caffeine works…
Hmmmm… we know this is just an estimate from one sample. Let’s create a confidence interval–a range of estimates that can express our confidence in making this estimate from a sample.
Let’s use boostrapping and the percentile method to create a 95% confidence interval.
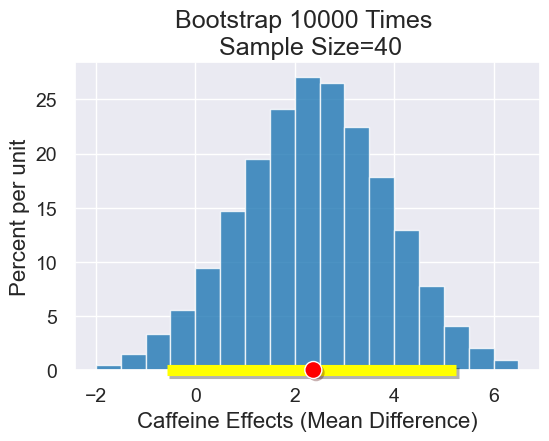
results = bootstrap_statistic(diff_array, np.mean, 10000)
ci_interval = confidence_interval(95, results)
print("95% confidence interval = ", ci_interval)
95% confidence interval = [-0.6 5.25]
table = Table().with_columns("Caffeine Effects (Mean Difference)",
                             results)
plot = table.hist("Caffeine Effects (Mean Difference)", bins = np.arange(-2,7,0.5))
plot.set_title("Bootstrap 10000 Times \n Sample Size="+str(caffeine.num_rows))
plot.interval(ci_interval)
plot.dot(effect)
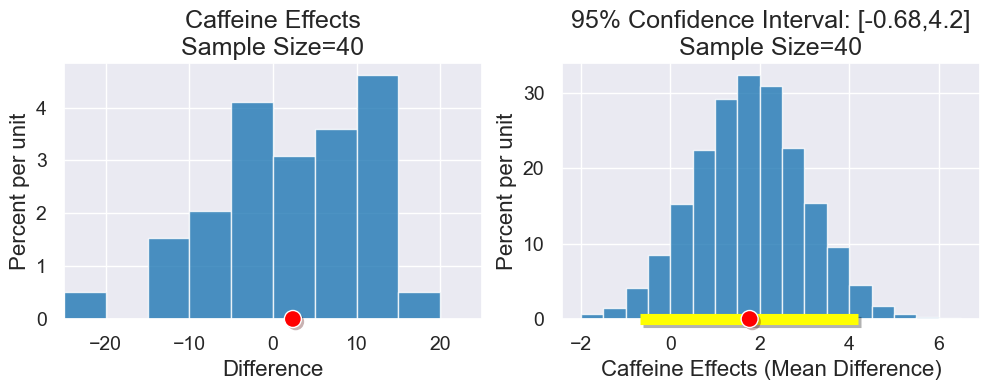
2. Variables Influencing CIs#
Many factors can influence the width of our confidence intervals, including the desired level of confidence in our process, the sample size, and the variability of the data in our sample. The following function allows you to manipulate all three variables to see their effects.
def caffeine_bootstrap(sample_size, variability, ci_level):
    """
    A function that helps us visualize how our estimation is affected by
    various variables, including sample size, variability, ci level.
    """
    # Create some fake data
    rng = np.random.default_rng(0)
    diff_array = np.round(rng.normal(2.4, variability, sample_size))

    # Our sample statistic
    observed_effect = np.mean(diff_array)

    # Estimate effect
    np.random.seed(0)
    results = bootstrap_statistic(diff_array, np.mean, 10000)
    ci_level = max(0, min(ci_level, 100))
    ci_interval = confidence_interval(ci_level, results)

    # Show results
    table = Table().with_columns("Caffeine Effects (Mean Difference)", results)
    plot = table.hist("Caffeine Effects (Mean Difference)", bins = np.arange(-2,7,0.5))
    ci_string = "[" + str(np.round(ci_interval.item(0), 2)) + "," + str(np.round(ci_interval.item(1), 2)) + "]"
    plot.set_title(str(ci_level) + "% Confidence Interval: " + ci_string + "\nSample Size="+str(sample_size))
    plot.interval(ci_interval)
    plot.dot(observed_effect)
interact(caffeine_bootstrap,
         sample_size = Slider(40,150,10),
         variability = Slider(0,10),
         ci_level = Slider(1,100))
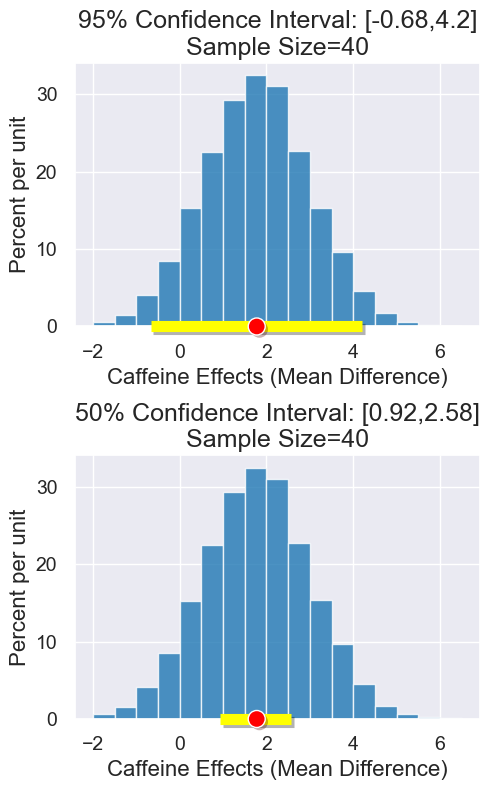
Confidence Level#
Decreasing our confidence level produces a narrower confidence interval, but we have less confidence that our process will produce an interval containing the true parameter.
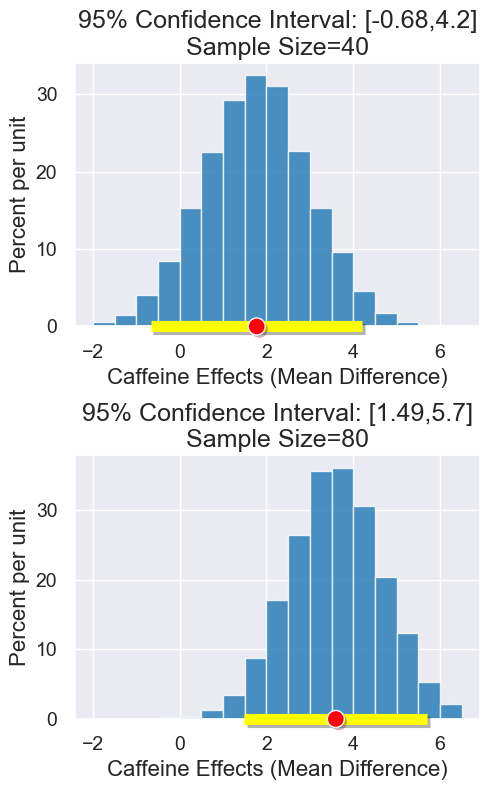
Sample Size#
Inreasing the sample size produces a narrower confidence interval with same confidence that our process will produce an interval containing the true parameter.
Variability#
Reduced variability in our sample also leads to narrower confidence intervals, but this is dependent on the sample and not under our control.
High variability#
Low variability#