Columns and Rows
Contents
Columns and Rows#
from datascience import *
from cs104 import *
import numpy as np

%matplotlib inline
1. Table Review: Hopkin’s Forest Tree Surveys#


trees = Table().read_table('data/hopkins-plot-0011.csv')
trees
| genus | species | common name | count |
|---|---|---|---|
| Acer | pensylvanicum | Maple, striped | 24 |
| Acer | rubrum | Maple, red | 20 |
| Acer | saccharum | Maple, sugar | 2 |
| Betula | alleghaniensis | Birch, yellow | 7 |
| Betula | lenta | Birch, black | 2 |
| Betula | papyrifera | Birch, paper | 2 |
| Fagus | grandifolia | Beech, American | 125 |
| Quercus | rubra | Oak, red | 1 |
# Use our str method from last time!
print("This table has " + str(trees.num_rows) + " rows and " + str(trees.num_columns) + " columns")
This table has 8 rows and 4 columns
Review Table operations
trees.sort("count", descending=True)
| genus | species | common name | count |
|---|---|---|---|
| Fagus | grandifolia | Beech, American | 125 |
| Acer | pensylvanicum | Maple, striped | 24 |
| Acer | rubrum | Maple, red | 20 |
| Betula | alleghaniensis | Birch, yellow | 7 |
| Acer | saccharum | Maple, sugar | 2 |
| Betula | lenta | Birch, black | 2 |
| Betula | papyrifera | Birch, paper | 2 |
| Quercus | rubra | Oak, red | 1 |
trees.sort("count", descending=True).sort("genus", distinct=True)
| genus | species | common name | count |
|---|---|---|---|
| Acer | pensylvanicum | Maple, striped | 24 |
| Betula | alleghaniensis | Birch, yellow | 7 |
| Fagus | grandifolia | Beech, American | 125 |
| Quercus | rubra | Oak, red | 1 |
maples = trees.where("common name", are.containing("Maple"))
maples
| genus | species | common name | count |
|---|---|---|---|
| Acer | pensylvanicum | Maple, striped | 24 |
| Acer | rubrum | Maple, red | 20 |
| Acer | saccharum | Maple, sugar | 2 |
Quick Array review#
maple_counts = maples.column("count")
maple_counts
array([24, 20, 2])
sum(maple_counts)
46
maple_counts.item(0)
24
maple_counts.item(2)
2
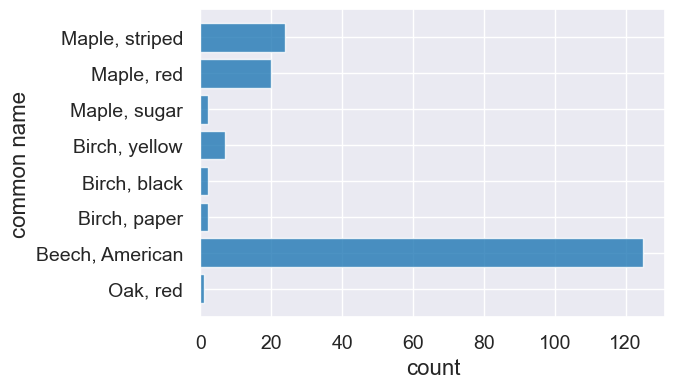
Visualization#
Let’s explore the data with a couple plots.
trees.barh('common name', 'count')
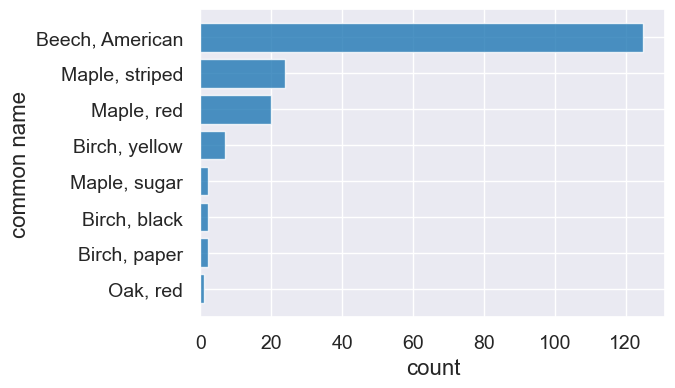
trees.sort('count', descending=True).barh('common name', 'count')
A quick method chaining example.
trees.sort('count', descending=True).where('common name', are.containing('Maple')).barh('common name', 'count')
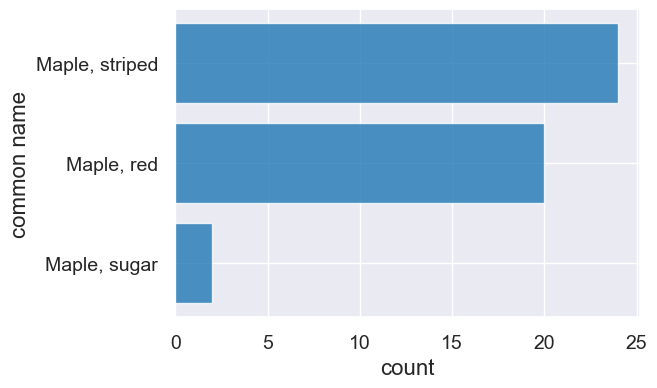
sorted_trees = trees.sort('count', descending=True)
maples = sorted_trees.where('common name', are.containing('Maple'))
maples.barh('common name', 'count')

Select columns.
trees.select("common name", "count")
| common name | count |
|---|---|
| Maple, striped | 24 |
| Maple, red | 20 |
| Maple, sugar | 2 |
| Birch, yellow | 7 |
| Birch, black | 2 |
| Birch, paper | 2 |
| Beech, American | 125 |
| Oak, red | 1 |
Q: Return just the first 3 species names that appear first in the alphabet.
species = trees.select("species").sort("species", descending=False).take(make_array(0,1,2))
species
| species |
|---|
| alleghaniensis |
| grandifolia |
| lenta |
What if we want the top 10? 20? 30?
2. Numpy methods#
Numpy is a package for numerical computing in Python.
We will use numpy methods throughout this course to help us understand trends in data.
# In this class, we will always import numpy the same way
import numpy as np
Creating ranges and take#
What if I wanted the top 50? make_array(0,1,2,...,49)? Ugh.
We can make an array for a range of numbers with np.arange(low,high), which gives us the integers in the range [low,high).
np.arange(0, 3)
array([0, 1, 2])
np.arange(0, 50)
array([ 0,  1,  2,  3,  4,  5,  6,  7,  8,  9, 10, 11, 12, 13, 14, 15, 16,
       17, 18, 19, 20, 21, 22, 23, 24, 25, 26, 27, 28, 29, 30, 31, 32, 33,
       34, 35, 36, 37, 38, 39, 40, 41, 42, 43, 44, 45, 46, 47, 48, 49])
first3 = species.take(np.arange(0, 3))
first3
| species |
|---|
| alleghaniensis |
| grandifolia |
| lenta |
first3 = species.take(np.arange(3))
first3
| species |
|---|
| alleghaniensis |
| grandifolia |
| lenta |
Why not just use show? Show doesn’t actually create a new table of the data we want, it just displays it.
other_first3 = species.show(3)
| species |
|---|
| alleghaniensis |
| grandifolia |
| lenta |
other_first3 # no real value stored in this variable.
New numpy methods#
We can measure how much the radius of a tree grows in a given year by measuring the width of tree ring for that year:

Suppose we have the ring widths (in mm) for a tree for five years. Let’s store this in an array.
ring_widths = make_array(3, 2, 1, 1, 3)
ring_widths
array([3, 2, 1, 1, 3])
Q: What was the total growth?
np.sum(ring_widths)
10
mean_width = np.mean(ring_widths)
mean_width
2.0
Q: How did the growth rate change from year-to-year?
np.diff(ring_widths)
array([-1, -1, 0, 2])
Q: Compute change in area, rounded to the nearest whole number of mm^2.
np.round(np.pi * ring_widths**2)
array([28., 13., 3., 3., 28.])
More Questions…#
What is the total proportion of maples in the plot?
sum(maple_proportions)
0.25136612021857924
What is the proportion of non-maples?
1 - sum(maple_proportions)
0.7486338797814207
What is the greatest proportion of any species in our plot?
max(trees.column('count') / total_count)
0.6830601092896175
3. Creating a Table from Scratch#
Premise: Suppose you find some really interesting facts online, for example, the list of the world’s largest giant sequoia trees.

Sometimes you may want to manually take the data you’re viewing and put it into your Python code. Let’s make a table from scratch (rather than a .csv file) from an array and the .with_columns() method.
names = make_array('General Sherman', 'General Grant', 'President')
trunk_volume = make_array(52508, 46608, 45148)
big_trees = Table().with_columns('Name', names)
big_trees
| Name |
|---|
| General Sherman |
| General Grant |
| President |
You can extend existing Tables with new arrays.
big_trees = big_trees.with_columns('Trunk Volume',trunk_volume)
big_trees
| Name | Trunk Volume |
|---|---|
| General Sherman | 52508 |
| General Grant | 46608 |
| President | 45148 |
We can also create Tables with multiple arrays at the same time.
big_trees2 = Table().with_columns('Name', names,
                                 'Trunk Volume', trunk_volume)
big_trees2
| Name | Trunk Volume |
|---|---|
| General Sherman | 52508 |
| General Grant | 46608 |
| President | 45148 |
Table info#
big_trees.labels
('Name', 'Trunk Volume')
big_trees.num_rows
3
big_trees.num_columns
2
Relabeling columns#
big_trees.relabeled('Trunk Volume', 'Trunk (cubic ft)')
| Name | Trunk (cubic ft) |
|---|---|
| General Sherman | 52508 |
| General Grant | 46608 |
| President | 45148 |
Recall, if we want the results of a method to persist we have to reassign the variable.
big_trees
| Name | Trunk Volume |
|---|---|
| General Sherman | 52508 |
| General Grant | 46608 |
| President | 45148 |
big_trees = big_trees.relabeled('Trunk Volume', 'Trunk (cubic ft)')
big_trees
| Name | Trunk (cubic ft) |
|---|---|
| General Sherman | 52508 |
| General Grant | 46608 |
| President | 45148 |
Adding columns#
How much do the these tree trunks weigh? We can estimate that by assuming their trunks weigh about 63 lbs per cubic foot.
weights = big_trees.column('Trunk (cubic ft)') * 63
big_trees = big_trees.with_columns('Trunk Weight (lbs)', weights)
big_trees
| Name | Trunk (cubic ft) | Trunk Weight (lbs) |
|---|---|---|
| General Sherman | 52508 | 3308004 |
| General Grant | 46608 | 2936304 |
| President | 45148 | 2844324 |