Interpreting Confidence
from datascience import *
%matplotlib inline
import matplotlib.pyplot as plots
plots.style.use('fivethirtyeight')
import numpy as np
import warnings
warnings.simplefilter(action='ignore', category=np.VisibleDeprecationWarning)
warnings.simplefilter(action='ignore', category=UserWarning)

from ipywidgets import interact, interactive, fixed, interact_manual
import ipywidgets as widgets
1. Estimate percent purple in all 2nd generation plants
Population: all 2nd generation plants
Sample: Mendel’s garden: 929 plants, 709 which had purple flowers
Statistic: Percent Purple
# Table with Mendel's sample
mendel_garden = Table().read_table('data/mendel_garden_sample.csv')
mendel_garden
| Plant Number | Color |
|---|---|
| 0 | Purple |
| 1 | Purple |
| 2 | White |
| 3 | White |
| 4 | Purple |
| 5 | Purple |
| 6 | Purple |
| 7 | Purple |
| 8 | Purple |
| 9 | Purple |
... (919 rows omitted)
mendel_garden.num_rows
929
#Statistic: percent purple flowers
def percent_purple(table):
    color = table.column('Color')
    proportion = sum(color == "Purple") / len(color)
    return proportion*100
observed_statistic = percent_purple(mendel_garden)
observed_statistic
76.31862217438106
Review bootstrapping
def bootstrap(observed_sample, num_trials):

    bootstrap_statistics = make_array()

    for i in np.arange(0, num_trials):
        #Key: in bootstrapping we must always sample with replacement
        simulated_resample = observed_sample.sample()
        #the statistic is the only line that changes from last lecture
        resample_statistic = percent_purple(simulated_resample)
        bootstrap_statistics = np.append(bootstrap_statistics, resample_statistic)

    return bootstrap_statistics
bootstrap_statistics = bootstrap(mendel_garden, 10000)
# Helper function to plot our Mendel data
def mendel_plot(title, observed_statistic, bootstrap_statistics):
    """
    Helper to plot the results of a bootstrap for Mendel with appropriate
    axes and titles.
    """
    results = Table().with_column('Bootstrap Samples Percent Purple', bootstrap_statistics)
    results.hist(bins=np.arange(72, 82, 0.5))
    plots.scatter(observed_statistic, 0, color='red', s=100, zorder=10, clip_on=False);
    plots.title(title)
    plots.xlim(72, 82)
    plots.ylim(0,0.35);
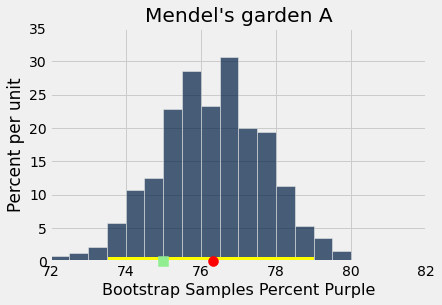
# Put in Table and analyze results
mendel_plot("Mendel's garden A", observed_statistic, bootstrap_statistics)

2. Bootstrap Percentile Method for Confidence Interval
The interval of estimates is the “middle 95%” of the bootstrap estimates.
# Get the endpoints of the 95% confidence interval
left = percentile(2.5, bootstrap_statistics)
right = percentile(97.5, bootstrap_statistics)

make_array(left, right)
array([73.51991389, 79.00968784])
mendel_plot("Mendel's garden A", observed_statistic, bootstrap_statistics)
plots.plot([left, right], [0, 0], color='yellow', lw=8);
plots.scatter(75,0,s=100,color="lightgreen",marker="s", zorder=10, clip_on=False);
def percentile_method(ci_percent, bootstrap_statistics):
    """
    Return an array with the lower and upper bound of the ci_percent confidence interval.
    """
    # percent in each of the the left/right tails
    percent_in_each_tail = (100 - ci_percent) / 2
    left = percentile(percent_in_each_tail, bootstrap_statistics)
    right = percentile(100 - percent_in_each_tail, bootstrap_statistics)
    return make_array(left, right)
A visualization of confidence interval sizes for different confidence levels.
def visualize_ci(ci_percent):
    mendel_plot("Mendel's garden A", observed_statistic, bootstrap_statistics)

    left,right = left_right = percentile_method(ci_percent, bootstrap_statistics)
    plots.plot(left_right, [0, 0], color='yellow', lw=8)

_ = widgets.interact(visualize_ci,
                     ci_percent=make_array(50,80,90,95,99))
Confidence intervals will be different for different samples and different runs of the bootstrap. How different???
def visualize_ci_with_different_samples(random_seed, ci_percent):
    np.random.seed(random_seed)
    sample = mendel_garden.sample()
    bootstrap_statistics = bootstrap(sample, 500)
    mendel_plot("Mendel's garden", percent_purple(sample), bootstrap_statistics)

    left,right = left_right = percentile_method(ci_percent, bootstrap_statistics)
    plots.plot(left_right, [0, 0], color='yellow', lw=8)

_ = widgets.interact(visualize_ci_with_different_samples,
                     random_seed=(0,100),
                     ci_percent=make_array(50,80,90,95,99))
Evaluating confidence intervals
CI with Boostrap percentiles procedure:
Take a random sample of the population
Take bootstrap resamples of the sample
Construct 95% CI via percentile method on the bootstrap resamples
What does a confidence interval actually mean? If we repeat this procedure 100 times, we would expect the true parameter to fall in the confidence interval 95/100 times.
We can evaluate this via an “oracle”–looking at the true parameter. But note, we would not see this parameter in the real world.
# A population with 10k plants and 75% purple as true parameter
population = Table().read_table('data/mendel_population.csv')
population.num_rows
10000
true_parameter = percent_purple(population)
true_parameter
75.0
# Note: this is very slow to compute for more than about 20 repeititions
num_eval_repeats = 40
sample_size = 929 #size of Mendel's garden
num_bootstrap_trials = 1000

count_contains_true_param = 0

for i in np.arange(0, num_eval_repeats):
    one_random_sample = population.sample(sample_size, with_replacement=False)
    bootstrap_statistics = bootstrap(one_random_sample, num_bootstrap_trials)
    left, right = percentile_method(95,bootstrap_statistics)

    if left <= true_parameter <= right:
        count_contains_true_param += 1
        plot_color = 'skyblue'
    else:
        plot_color = 'red'

    plots.plot([left, right], [i, i], color=plot_color, lw=1)

plots.xlabel('Confidence Interval for Percent Purple in Sample')
plots.ylabel('Evaluation repeat number')
plots.title('Oracle evaluation');
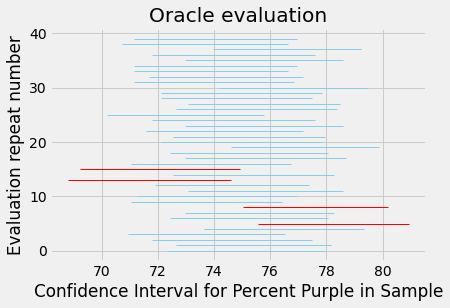
count_contains_true_param
36