Randomized Controlled Experiments
from datascience import *
%matplotlib inline
import matplotlib.pyplot as plots
plots.style.use('fivethirtyeight')
import numpy as np
import sys
import warnings
warnings.simplefilter(action='ignore', category=np.VisibleDeprecationWarning)

from ipywidgets import interact, interactive, fixed, interact_manual
import ipywidgets as widgets
1. Back Pain: Randomized Controlled Experiments
rct = Table.read_table('data/bta.csv')
rct.show()
| Group | Result |
|---|---|
| Control | 1 |
| Control | 1 |
| Control | 0 |
| Control | 0 |
| Control | 0 |
| Control | 0 |
| Control | 0 |
| Control | 0 |
| Control | 0 |
| Control | 0 |
| Control | 0 |
| Control | 0 |
| Control | 0 |
| Control | 0 |
| Control | 0 |
| Control | 0 |
| Treatment | 1 |
| Treatment | 1 |
| Treatment | 1 |
| Treatment | 1 |
| Treatment | 1 |
| Treatment | 1 |
| Treatment | 1 |
| Treatment | 1 |
| Treatment | 1 |
| Treatment | 0 |
| Treatment | 0 |
| Treatment | 0 |
| Treatment | 0 |
| Treatment | 0 |
| Treatment | 0 |
rct.pivot('Result', 'Group') #Recall: the default aggregation function counts the items
| Group | 0.0 | 1.0 |
|---|---|---|
| Control | 14 | 2 |
| Treatment | 6 | 9 |
# This tells us the proportion in each group who improved.
rct.group('Group', np.mean)
| Group | Result mean |
|---|---|
| Control | 0.125 |
| Treatment | 0.6 |
The Test Statistic
def difference_of_proportions(table, group_label, value_label):
    """Takes: name of table,
    column label that indicates which group the row relates to
    Returns: Difference of proportions of 1's in the two groups"""

    # table containing group means
    proportions_table = table.group(group_label, np.mean)

    # array of group means
    proportions = proportions_table.column(value_label + ' mean')

    return abs(proportions.item(1) - proportions.item(0))
observed_diff = difference_of_proportions(rct, 'Group', 'Result')
observed_diff
0.475
Sampling
shuffled_labels = rct.sample(with_replacement=False).column('Group')
original_and_shuffled = rct.with_column('Shuffled Label', shuffled_labels)
original_and_shuffled
| Group | Result | Shuffled Label |
|---|---|---|
| Control | 1 | Treatment |
| Control | 1 | Control |
| Control | 0 | Treatment |
| Control | 0 | Treatment |
| Control | 0 | Treatment |
| Control | 0 | Treatment |
| Control | 0 | Control |
| Control | 0 | Treatment |
| Control | 0 | Treatment |
| Control | 0 | Treatment |
... (21 rows omitted)
# Original RCT
original_and_shuffled.select('Result', 'Group').group('Group', np.mean)
| Group | Result mean |
|---|---|
| Control | 0.125 |
| Treatment | 0.6 |
# Shuffled RCT from the permutation test
original_and_shuffled.select('Result', 'Shuffled Label').group('Shuffled Label', np.mean)
| Shuffled Label | Result mean |
|---|---|
| Control | 0.375 |
| Treatment | 0.333333 |
def permutation_sample(table, group_column_name):
    """
    Returns: The table with a new "Shuffled Label" column containing
    the shuffled values of the group column.
    """

    # array of shuffled labels
    shuffled_labels = table.sample(with_replacement=False).column(group_column_name)

    # table of numerical variable and shuffled labels
    shuffled_table = table.with_column('Shuffled Label', shuffled_labels)

    return shuffled_table
Simulation and Plotting
def empirical_difference_of_proportions_distribution(num_iterations):
    simulated_diffs = make_array()

    for i in np.arange(num_iterations):

        one_sample = permutation_sample(rct, 'Group')
        statistic_one_sample = difference_of_proportions(one_sample,
                                                             "Shuffled Label",
                                                             'Result')

        simulated_diffs = np.append(simulated_diffs, statistic_one_sample)

    return simulated_diffs
simulated_diffs = empirical_difference_of_proportions_distribution(2000)
results = Table().with_columns('Absolute Difference between Treatment and Control',
                               simulated_diffs)
results.hist(left_end = observed_diff, bins=np.arange(0,0.7,0.1))
plots.scatter(observed_diff, 0, color='red', s=60, clip_on=False, zorder=3)
plots.title('Back pain experiment');
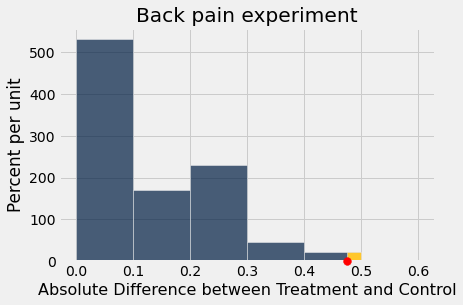
P-value
sum(simulated_diffs >= observed_diff) / len(simulated_diffs)
0.01
2. John Snow from scratch
snows_data = Table().read_table('data/snow_data.csv')
snows_data.show(10)
| Water Company | Cholera death |
|---|---|
| Lambeth | False |
| S&V | False |
| S&V | False |
| S&V | False |
| S&V | False |
| S&V | False |
| S&V | True |
| S&V | False |
| Lambeth | False |
| S&V | False |
... (66143 rows omitted)
# We have not prepared anything for this example.
# Direct us and we will make mistakes together.