Conditionals and Loops
from datascience import *
import numpy as np

%matplotlib inline
import matplotlib.pyplot as plots
plots.style.use('fivethirtyeight')
import warnings
warnings.simplefilter(action='ignore', category=np.VisibleDeprecationWarning)
Booleans and Comparison Operators
3 > 1
True
type(3 > 1)
bool
3 = 3
  File "/var/folders/md/kwd9nc_d2ns0hw9wsvdrnt2c0000gn/T/ipykernel_4262/3802935557.py", line 1
    3 = 3
    ^
SyntaxError: cannot assign to literal
3 == 3
True
x = 5
y = 12
x == 7
False
y - x
7
4 < y - x <= 6
False
4 < y - x
True
y - x <= 6
False
True and False
False
True or False
True
True and True
True
Monopoly
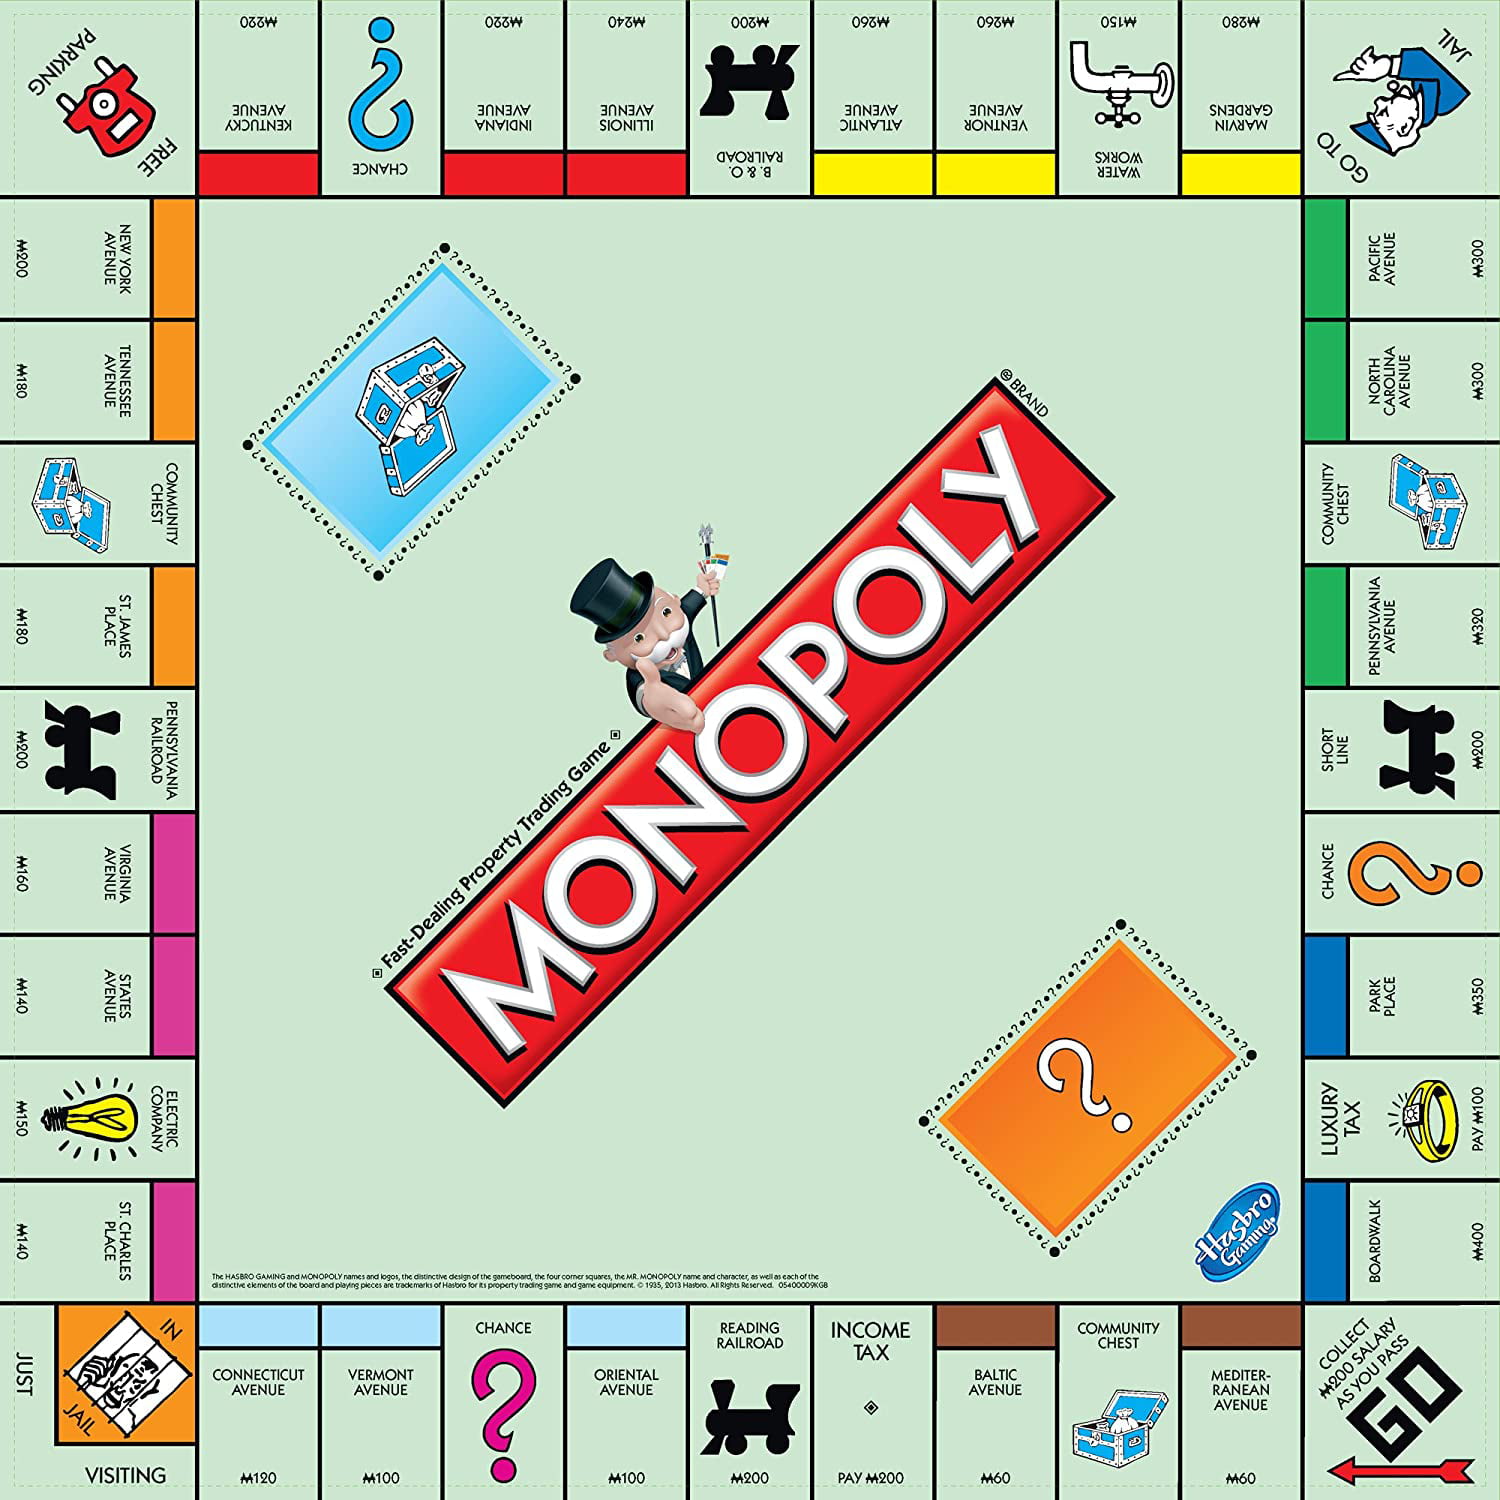
monopoly = Table().read_table("data/monopoly.csv")
monopoly
| Name | Space | Color | Position | Price | PriceBuild | Rent | RentBuild1 | RentBuild2 | RentBuild3 | RentBuild4 | RentBuild5 | Number |
|---|---|---|---|---|---|---|---|---|---|---|---|---|
| Go | Go | None | 0 | 0 | 0 | 0 | 0 | 0 | 0 | 0 | 0 | 0 |
| Mediterranean Avenue | Street | Brown | 1 | 60 | 50 | 2 | 10 | 30 | 90 | 160 | 250 | 2 |
| Community Chest | Chest | None | 2 | 0 | 0 | 0 | 0 | 0 | 0 | 0 | 0 | 0 |
| Baltic Avenue | Street | Brown | 3 | 60 | 50 | 4 | 20 | 60 | 180 | 320 | 450 | 2 |
| Income Tax | Tax | None | 4 | 200 | 0 | 200 | 0 | 0 | 0 | 0 | 0 | 0 |
| Reading Railroad | Railroad | None | 5 | 200 | 0 | 25 | 0 | 0 | 0 | 0 | 0 | 0 |
| Oriental Avenue | Street | LightBlue | 6 | 100 | 50 | 6 | 30 | 90 | 270 | 400 | 550 | 3 |
| Chance | Chance | None | 7 | 0 | 0 | 0 | 0 | 0 | 0 | 0 | 0 | 0 |
| Vermont Avenue | Street | LightBlue | 8 | 100 | 50 | 6 | 30 | 90 | 270 | 400 | 550 | 3 |
| Connecticut Avenue | Street | LightBlue | 9 | 120 | 50 | 8 | 40 | 100 | 300 | 450 | 600 | 3 |
... (30 rows omitted)
tiny_monopoly = monopoly.where('Color', are.not_equal_to('None'))
tiny_monopoly = tiny_monopoly.where('Space', are.containing('Street'))
tiny_monopoly = tiny_monopoly.select('Name', 'Color', 'Price')
tiny_monopoly = tiny_monopoly.sort('Name')
tiny_monopoly.show()
| Name | Color | Price |
|---|---|---|
| Atlantic Avenue | Yellow | 260 |
| Baltic Avenue | Brown | 60 |
| Boardwalk | Blue | 400 |
| Connecticut Avenue | LightBlue | 120 |
| Illinois Avenue | Red | 240 |
| Indiana Avenue | Red | 220 |
| Kentucky Avenue | Red | 220 |
| Marvin Gardens | Yellow | 280 |
| Mediterranean Avenue | Brown | 60 |
| New York Avenue | Orange | 200 |
| North Carolina Avenue | Green | 300 |
| Oriental Avenue | LightBlue | 100 |
| Pacific Avenue | Green | 300 |
| Park Place | Blue | 350 |
| Pennsylvania Avenue | Green | 320 |
| St. Charles Place | Pink | 140 |
| St. James Place | Orange | 180 |
| States Avenue | Pink | 140 |
| Tennessee Avenue | Orange | 180 |
| Ventnor Avenue | Yellow | 260 |
| Vermont Avenue | LightBlue | 100 |
| Virginia Avenue | Pink | 160 |
Suppose we only have 220 dollars. How many properties could we buy for exactly 220 dollars?
price = tiny_monopoly.column("Price")
price
array([260,  60, 400, 120, 240, 220, 220, 280,  60, 200, 300, 100, 300,
       350, 320, 140, 180, 140, 180, 260, 100, 160])
price == 220
array([False, False, False, False, False,  True,  True, False, False,
       False, False, False, False, False, False, False, False, False,
       False, False, False, False])
sum(price==220)
2
np.count_nonzero(price == 220)
2
How many properties could we buy for less than or equal to 200 dollars?
price
array([260,  60, 400, 120, 240, 220, 220, 280,  60, 200, 300, 100, 300,
       350, 320, 140, 180, 140, 180, 260, 100, 160])
price <= 200
array([False,  True, False,  True, False, False, False, False,  True,
        True, False,  True, False, False, False,  True,  True,  True,
        True, False,  True,  True])
np.count_nonzero(price <= 200)
11
How many of the Monopoly spaces are light blue?
sum(monopoly.column("Color") == "LightBlue")
3
Conditional Statements
def price_rating(price):
    if price < 100:
        print("Inexpensive")

price_rating(50)
Inexpensive
price_rating(500)
def price_rating(price):
    if price < 100:
        print("Inexpensive")
    else:
        print("Expensive")
price_rating(500)
Expensive
# return a value instead of printing
def price_rating(price):
    if price < 200:
        return "Inexpensive"
    elif price < 300:
        return "Expensive"
    elif price < 400:
        return "Very Expensive"
    else:
        return "Outrageous"

ratings = tiny_monopoly.apply(price_rating, 'Price')
ratings
array(['Expensive', 'Inexpensive', 'Outrageous', 'Inexpensive',
       'Expensive', 'Expensive', 'Expensive', 'Expensive', 'Inexpensive',
       'Expensive', 'Very Expensive', 'Inexpensive', 'Very Expensive',
       'Very Expensive', 'Very Expensive', 'Inexpensive', 'Inexpensive',
       'Inexpensive', 'Inexpensive', 'Expensive', 'Inexpensive',
       'Inexpensive'], dtype='<U14')
rated_monopoly = tiny_monopoly.with_columns("Cost Rating", ratings)
rated_monopoly
| Name | Color | Price | Cost Rating |
|---|---|---|---|
| Atlantic Avenue | Yellow | 260 | Expensive |
| Baltic Avenue | Brown | 60 | Inexpensive |
| Boardwalk | Blue | 400 | Outrageous |
| Connecticut Avenue | LightBlue | 120 | Inexpensive |
| Illinois Avenue | Red | 240 | Expensive |
| Indiana Avenue | Red | 220 | Expensive |
| Kentucky Avenue | Red | 220 | Expensive |
| Marvin Gardens | Yellow | 280 | Expensive |
| Mediterranean Avenue | Brown | 60 | Inexpensive |
| New York Avenue | Orange | 200 | Expensive |
... (12 rows omitted)
rated_monopoly.where('Cost Rating', 'Inexpensive')
| Name | Color | Price | Cost Rating |
|---|---|---|---|
| Baltic Avenue | Brown | 60 | Inexpensive |
| Connecticut Avenue | LightBlue | 120 | Inexpensive |
| Mediterranean Avenue | Brown | 60 | Inexpensive |
| Oriental Avenue | LightBlue | 100 | Inexpensive |
| St. Charles Place | Pink | 140 | Inexpensive |
| St. James Place | Orange | 180 | Inexpensive |
| States Avenue | Pink | 140 | Inexpensive |
| Tennessee Avenue | Orange | 180 | Inexpensive |
| Vermont Avenue | LightBlue | 100 | Inexpensive |
| Virginia Avenue | Pink | 160 | Inexpensive |
rated_monopoly.where('Cost Rating', 'Outrageous')
| Name | Color | Price | Cost Rating |
|---|---|---|---|
| Boardwalk | Blue | 400 | Outrageous |
Simulation and Loops
Think-pair-share
Suppose your friend proposes that you switch your electronic version of Monopoly so players roll one dice and multiply its value by two instead rather than the more standard way of rolling two dice and summing their values.
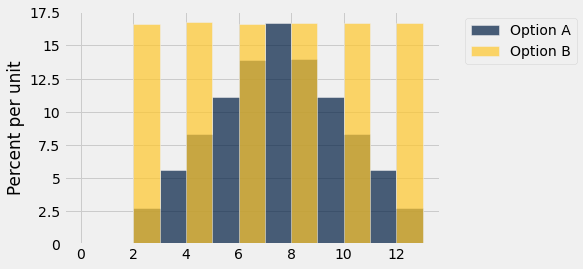
Which scenario will give you a higher score on average?
Option A. Roll 2 dice and sum their values.
Option B. Roll one dice and multiply it’s value by two.
Random Selection
dice = np.arange(1,7)
dice
array([1, 2, 3, 4, 5, 6])
Here, np.random.choice randomly picks one item from the array and it is equally likely to pick any of the items.
np.random.choice(dice)
5
We can repeat the process by calling a second argument.
np.random.choice(dice, 10)
array([1, 4, 4, 4, 2, 6, 2, 3, 5, 2])
rolls = np.random.choice(dice,100)
sum(rolls == 6)
19
np.mean(rolls)
3.51
Simulating the Question
N = 1000000
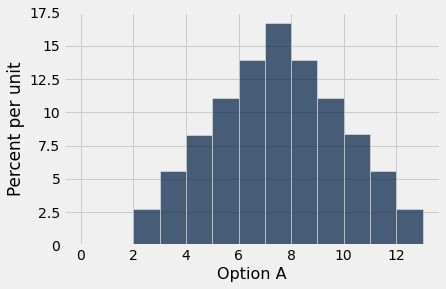
option_a = np.random.choice(dice, N) + np.random.choice(dice, N)
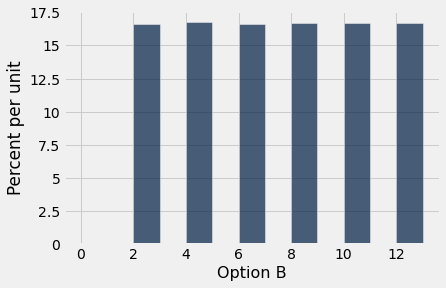
option_b = 2 * np.random.choice(dice, N)
print("Option A Mean: ", np.mean(option_a))
print("Option B Mean: ", np.mean(option_b))
Option A Mean:  7.001924
Option B Mean:  7.001088
samples = Table().with_columns("Option A", option_a, "Option B", option_b)
samples.hist("Option A", bins=np.arange(0,14))
samples.hist("Option B", bins=np.arange(0,14))
samples.hist(bins=np.arange(0,14))
Think-Pair-Share 2

If you flip a coin 100 times, what are the odds you get between 40 and 60 heads?
Simulating One Trial
coin = make_array('heads', 'tails')
np.random.choice(coin)
'tails'
tosses = np.random.choice(coin, 100)
tosses
array(['tails', 'heads', 'tails', 'tails', 'tails', 'tails', 'heads',
       'tails', 'heads', 'tails', 'heads', 'tails', 'tails', 'tails',
       'heads', 'tails', 'heads', 'tails', 'tails', 'tails', 'tails',
       'tails', 'heads', 'tails', 'heads', 'tails', 'heads', 'tails',
       'heads', 'heads', 'tails', 'heads', 'tails', 'heads', 'tails',
       'heads', 'heads', 'tails', 'heads', 'heads', 'tails', 'heads',
       'tails', 'tails', 'heads', 'tails', 'heads', 'tails', 'heads',
       'heads', 'heads', 'heads', 'tails', 'heads', 'heads', 'tails',
       'tails', 'heads', 'tails', 'tails', 'heads', 'tails', 'heads',
       'tails', 'heads', 'tails', 'tails', 'tails', 'tails', 'tails',
       'heads', 'tails', 'heads', 'heads', 'tails', 'heads', 'heads',
       'tails', 'tails', 'heads', 'tails', 'heads', 'heads', 'heads',
       'heads', 'tails', 'heads', 'heads', 'tails', 'heads', 'heads',
       'heads', 'heads', 'heads', 'tails', 'tails', 'heads', 'heads',
       'heads', 'heads'], dtype='<U5')
sum(tosses == 'heads')
51
All in one cell: run it a bunch!
sum(np.random.choice(coin, 100) == 'heads')
55
Running Many Trials: For Loops
for name in ['Katie', 'Steve']:
    print(name)
Katie
Steve
for i in np.arange(0,10):
    print("iteration", i)
iteration 0
iteration 1
iteration 2
iteration 3
iteration 4
iteration 5
iteration 6
iteration 7
iteration 8
iteration 9
# Steve: Important for prelab to show one loop that accumulates a value...
total = 0
for i in np.arange(0,10):
    total = total + i
total
45
for i in np.arange(0,10):
    print(sum(np.random.choice(coin, 100) == 'heads'))
51
56
47
47
46
41
50
52
41
54
Appending to an array of outcomes
outcomes = make_array()
One simulation: run it a bunch!
num_heads = sum(np.random.choice(coin, 100) == 'heads')
outcomes = np.append(outcomes, num_heads)
outcomes
array([54.])
All in one cell:
outcomes = make_array()
number_simulations = 10000
for i in np.arange(0,number_simulations):
    num_heads = sum(np.random.choice(coin, 100) == 'heads')
    outcomes = np.append(outcomes, num_heads)

outcomes
array([45., 49., 50., ..., 58., 45., 51.])
simulated_results = Table().with_column('Heads in 100 flips', outcomes)
simulated_results.hist(bins=np.arange(30, 70, 1))
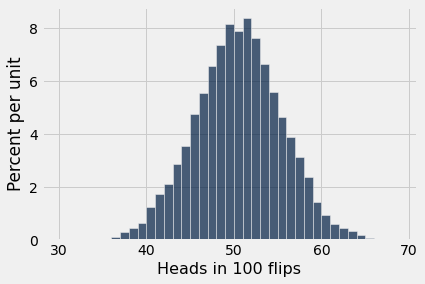
target_range = simulated_results.group("Heads in 100 flips").where("Heads in 100 flips", are.between(40,60))
target_range
| Heads in 100 flips | count |
|---|---|
| 40 | 124 |
| 41 | 176 |
| 42 | 213 |
| 43 | 287 |
| 44 | 355 |
| 45 | 474 |
| 46 | 554 |
| 47 | 658 |
| 48 | 737 |
| 49 | 815 |
... (10 rows omitted)
sum(target_range.column("count")) / simulated_results.num_rows
0.9558