Lab 6: Purple America
This lab explores visualizing election data by county and state through color and gradient. The data is logicaly split by election results and by county and state regions. A primary goal of this lab is to naturally organize the data using classes and clear, well-defined programming interfaces.
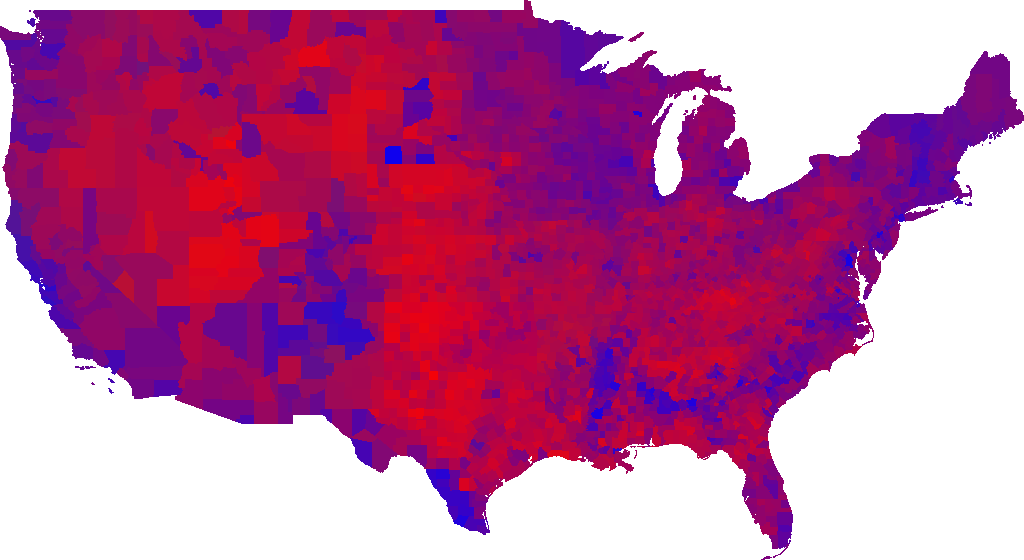
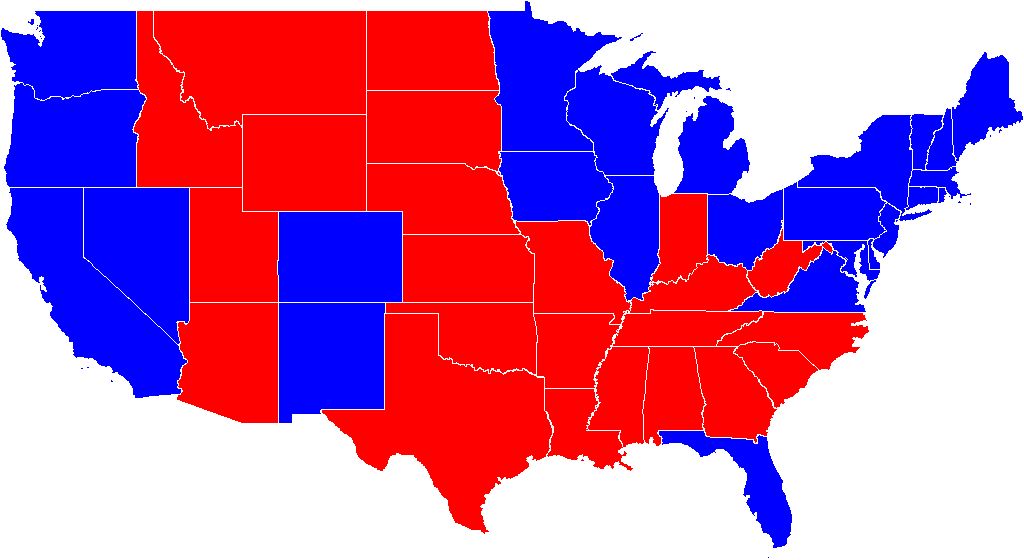
A modern, popular visualization technique for geographic difference is to color counties in the United States according to some statistic. You see it everywhere.
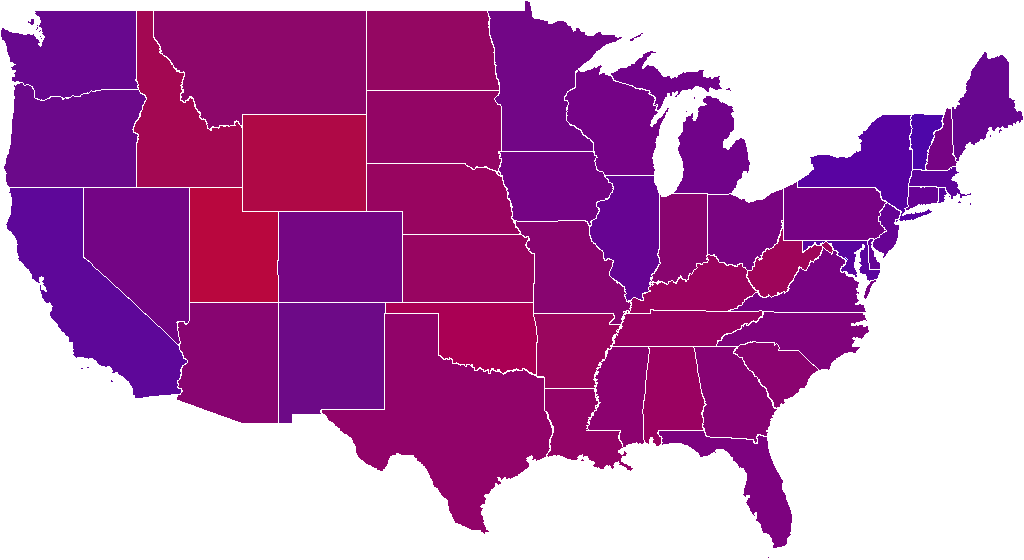
In the last presidential election, we read a lot about red states and blue states. But work by Robert Vanderbei shows that the USA is actually filled with purple states (well, Utah is pretty red and Vermont is pretty blue). We will write code to do these visualizations directly from election data and boundary information in longitudunal and latidunal format.
Step 1: Source Code
- Clone your private repo to an appropriate directory in your home folder
(
~/labsis a good choice):$ git clone https://github.com/williams-cs/<git-username>-lab6.git
Remember, you can always get the repo address by using the ssh copy-to-clipboard link on github. - Once inside your <git-username>-lab6 directory, create a virtual environment using
$ virtualenv -p python3 venv
- Activate your environment by typing:
$ . venv/bin/activate
- Use pip to install the pillows imaging library:
$ pip install pillow
- Remember that you must always activate your virtual environment when opening a new terminal
- Type
$ git branch
and notice that you are currently editing the master branch. - Create a new branch with
$ git branch purple
- Checkout this branch by typing
$ git checkout purple
- Any changes you make to the repository are now isolated on this branch.
Step 2: Data
There are two types of data.
- County and State Boundaries; and
- Election Results
Boundary Data
The boundary data is in CSV format. It has the the form
COUNTY,STATE,LONG1,LAT1,LONG2,LAT2,...,LONGN,LATN
where each successive pair of LONG,LAT values form a
point on the polygon defining a particular region (you should
think of longitude as x and latitude as y). Some county/state
pairs appear multiple times because they contain separate regions
(imagine a county comprised of a series of islands). There are
three types of boundary files:
- State / County Boundaries:
XX.csvwhereXXis a two-state abbreviation. - State / County Boundaries for the continental US:
US.csv— this is essentially a concatenation of all the state files. - State Boundaries for the continental US:
US-states.csv— this file has the formSTATE,USA,LONG1,LAT1,....
Election Data
The election data is in CSV format. It has the form
COUNTY,STATE,REPUBLICAN_VOTES,DEMOCRATIC_VOTES,OTHER_VOTES
where COUNTY,STATE matches an appropriate boundary line in a file from above. In fact, if a county / state pair has several boundaries, then the vote counts are repeated. So if bnd is a CSV reader for a boundary file and elc is a CSV reader for an election results file, one can write
for (co,st,r,d,o), boundary in zip(elc,bnd):
and be assured that the boundary corresponds to the results. In other words, that co == boundary[0] and st == boundary[1].
Naturally, there are three types of election results files:
- State / County results by year:
XXYYY.csvwhereXXis a two-state abbreviation andYYYYis a year. - State / County results for the continental US by year:
USYYYY.csv. - State results for the continental US by year:
US-statesYYYY.csv
Your program will take as input, two files—one boundary and one election—that are suitably matched. The data is available from a github repository. To access it, clone the repo into your lab 6 directory, but don't add the files to your lab 6 repo:
git clone https://github.com/williams-cs/election-data.git
You will have to clone this data again whenever you work on an OIT machine.
Step 3: Design
Your program should be split between three separate
files: region.py, plot.py,
and election.py. The region.py
and plot.py files will hold Region
and Plot classes respectively.
The election.py script will parse and create instances
of Region for each line of the input data and then
use an instance of the Plot class to create the
visualization.
Step 4: Region
The Region class represents a region (stored as a
list of long / lat pairs) and its vote counts. It provides
methods to find both the minimum and maximum longitudunal and
latitudunal values for the region. These values are used by
the Plot class to interpolate the region properly
into the image. This class also can determine plurality and
voting percentages by party for the region.
Here is the class skeleton. All the methods require definitions
except for the initialization routine, which is complete. You
should use the lats and longs methods in
your min_lat, max_lat, min_long,
and max_long methods respectively.
    class Region:
        """
        A region (represented by a list of long/lat coordinates) along with
        republican, democrat, and other vote counts.
        """

        def __init__(self, coords, r_votes, d_votes, o_votes):
            self.coords = coords
            self.r_votes = r_votes
            self.d_votes = d_votes
            self.o_votes = o_votes

        def longs(self):
            "Return a list of the longitudes of all the coordinates in the region"

        def lats(self):
            "Return a list of the latitudes of all the coordinates in the region"

        def min_long(self):
            "Return the minimum longitude of the region"

        def max_long(self):
            "Return the maximum longitude of the region"

        def min_lat(self):
            "Return the minimum latitude of the region"

        def max_lat(self):
            "Return the maximum latitude of the region"

        def plurality(self):
            """return 'REPUBLICAN','DEMOCRAT', or 'OTHER'
                depending on plurality of votes"""

        def total_votes(self):
            "The total number of votes cast in this region"

        def republican_percentage(self):
            "The precentage of republication votes cast in this region"

        def democrat_percentage(self):
            "The precentage of democrat votes cast in this region"

        def other_percentage(self):
            "The precentage of other votes cast in this region"
Make sure to test this class out in the Python REPL before proceeding. You can do this by typing
    >>> import region
    >>> r = region.Region([(1,1),(2,2),(4,2),(3,5)], 100, 200, 300)
    >>> r.plurality()
    'OTHER'
    >>> r.r_votes
    100
    >>> r.republican_percentage()
    0.16666666666666666
    >>> r.min_long()
    1
    >>> r.max_lat()
    5
Step 5: Plot
The Plot class encapsulates an image proportional in
size to a bounding box around a set of regions given in
longitudunal and longitudunal coordinates. It also provides the
ability to draw regions, appropriately filled, on the image.
Besides initialization, it contains two instance methods
(draw and save) and five static methods,
which appear first in the class definition. The static methods
are not instance methods because they don't rely on the current
state of the instance, nor do they change any state of the
instance—they are logically related to Plot,
which is why they live in the Plot namespace.
    from PIL import Image, ImageDraw
    from PIL.ImageColor import getrgb


    class Plot:

        """
        Provides the ability to map, draw and color regions in a long/lat
        bounding box onto a proportionally scaled image.
        """

        @staticmethod
        def interpolate(x_1, x_2, x_3, newlength):
            """linearly interpolates x_2 <= x_1 <= x3 into the range [0, newlength]"""

        @staticmethod
        def proportional_height(new_width, width, height):
            """return a height for new_width that is
               proportional to height with respect to width"""

        @staticmethod
        def fill(region, style):
            """return the fill color for region according to the given 'style'"""
            if style == "GRAD":
                return Plot.gradient(region)
            else:
                return Plot.solid(region)

        @staticmethod
        def solid(region):
            "return an appropriate solid color based on plurarlity of votes"

        @staticmethod
        def gradient(region):
            "return a gradient color based on percentages of votes"

        def __init__(self, width, min_long, min_lat, max_long, max_lat):
            """
            Create a width x height image where height is proportional to width
            with respect to the long/lat coordinates."""

        def save(self, filename):
            """save the current image to 'filename'"""

        def draw(self, region, style):
            """
            Draw 'region' in the given 'style' at the correct position on the
            current image"""
This week you will use the Python Image Library directly
instead of working with the image wrapper module.
Examining the warpper directly should give you some information on
how the programming interface works.
    from PIL import Image, ImageDraw, ImageFont

    def create_image(width, height):
        return Image.new("RGB", (width, height), (255, 255, 255))

    def draw_point(image, x, y, color):
        ImageDraw.Draw(image).point((x,y), color)

    def draw_rect(image, xy, fill=None, outline=None):
        ImageDraw.Draw(image).rectangle(xy, fill, outline)

    def save_image(image, filename):
        image.save(filename, "PNG")
Besides creating (im = Image.new(...)) and saving
(im.save(...)) images, you will use the the ImageDraw.Draw.polygon(xy,
fill=None, outline=None) method of the drawing context
to draw region boundaries. Notice that polygon is a
method of the ImageDraw.Draw class and not
the Image class (see the implementation
of draw_point and draw_rect above for
more examples).
Here are some implementation notes:
- The
__init__(self, width, ...)method should create an image of widthwidthand height proportional to dimensions given by the longitudunal / latidunal coodinates passed as arguments. Use theproportional_heightclass method to compute the height. - The
__init__method should also create instance variables for all longitudunal and latidunal values passed as arguments. You'll need these to properly interpolate regions in yourdrawmethod. - Use the
interpolatefunction to map coordinates in aRegiononto pixels in the image instance variable. - The
solidmethod can use thegetrgbfunction imported fromPILto get RGB values for a given color string. In other wordsgetrgb("RED")will return the tuple(255,0,0). - The color returned by
gradientshould have a red value proportional to the percentage of Republicaon votes cast in the region, a blue value proportional to the percentage of Democrat votes cast in the region, and a green value proportional to the percentage of other votes cast in the region. Use the appropriate methods ofRegionto help compute this color - The
drawmethod should first create a list of properly interpolated image coordinates from the givenregionargument. You might define local functionstrans_longandtrans_latthat respectively interpolate longitudunal and latidunal values into image coordinates, and a list comprehension to be helpful. Note that the latidunal values run bottom-to-top but the image y-values run top-to-bottom sotrans_latshould subtract the interpolated latidunal value from the image height lest you want an upside-down purple america.
Make sure to test your code:
    >>> import region
    >>> import plot
    >>> r = region.Region([(1,1),(2,2),(4,2),(3,5)], 100, 200, 300)
    >>> p = plot.Plot(100,0,0,8,10)
    >>> p.draw(r,"GRAD")
    >>> p.save("example.png")
Your should end up with a file called example.png that looks like this.

Step 6: The election.py script
The election.py script parses the input data
into Region instances and uses a Plot
instance to draw the regions onto an image. Here is the code
skeleton.
    import sys
    import csv
    import math
    from region import Region
    from plot import Plot

    def mercator(lat):
        """project latitude 'lat' according to Mercator"""
        lat_rad = (lat * math.pi) / 180
        projection = math.log(math.tan((math.pi / 4) + (lat_rad / 2)))
        return (180 * projection) / math.pi

    def main(results, boundaries, output, width, style):


    if __name__ == '__main__':
        results = sys.argv[1]
        boundaries = sys.argv[2]
        output = sys.argv[3]
        width = int(sys.argv[4])
        style = sys.argv[5]
        main(results, boundaries, output, width, style)
The main function takes five arguments:
results: the name of an election results file;boundaries: the name of a matching boundary file;output: the name of a file to output the visualization image;width: the width of the output image; andwidth: a string indicating how the fill style of the regions (i.e., either "GRAD" or "SOLID")
Some implementation notes:
- The
election.pyfile contains a function calledmercator, which can be used to project latitudunal coordinates from a sphere onto a cylinder. You will probably want to do this transformation immediately when reading in the coordinates. As an exercise, try not doing it and looking at the result. - You should iterate throught the
resultsandboundariesfiles in unison. Consider using a list comprehension to create a list ofRegionobjects, one per line. In other words, don't worry about streaming the data, but rather, creating a Region for each row and gathering them together in a list. - You might consider defining a local function
called
to_pointthat transforms a list of long / lat coordinates into a list of pairs of coordinates, where the lat coordinate is suitably projected. - Once you have a list of regions, it is easy enough to use
list comprehensions along with the functions
minandmaxto determine the bounding box of the regions.
In summary, you're main function should do the following:
- concurrently read lines from the boundary and election data; and
- create a list of regions;
- extract the minimum and maximum longitude and latitude from all the regions (think about finding the min amongst all minimimums and the max amongst all maximums);
- create a plot object with these values;
- iterate through the regions and draw each region using your
Plotinstance; and finally - save your image.
To run your code from the command line use
$ python3 election.py election-data/results/US2012.csv election-data/boundaries/US.csv output.png 1024 GRAD
Step 8: Optional Extensions
- Instead of using the formula above for creating purple colors, use a set of 5 colors or 7 colors, similar to this map. For example, you could use deep red to indicate elections where Republicans won by a big percentage, you could use pink to indicate elections where Republicans won by a small percentage, you could use grey to indicate incredibly close elections, light blue for small Democratic victories, and deep blue for large Democratic victories.
- Many geographically large counties have small populations, whereas many geographically small counties have relatively large populations. Can you come up with a color scheme that helps highlight this while also showing the election results?
- You can draw a map showing the net change in votes from one election to the next.
- You can go find other data online and show that instead of election results. For example, you maybe you could find average rainfall, altitude, poverty rates, obesity rates, linguistic variations (e.g. "soda" vs "pop" vs "coke") or anything else you'd like.
Step 7: Submission
- Now commit those additions to the repository:
$ git commit -a -m "some appropriate log message"
- Push your changes back to github repo:
$ git push
You will probably be asked to type$ git push --set-upstream origin purplewhich you should do. This pushes your purple branch back up to the GitHub Repo. - Now navigate to your GitHub repo using a web browser. You should see a list of recently pushed branches with links to compare and pull request. Go ahead and issue a PR
Credit
Thanks to Kevin Wayne for his Nifty Assignment.
Thanks to Rich Wicentowski for the nicely formatted data and the optional extension ideas.