Lab 5: Stock Viz
This lab explores visualizing stock data by market cap and percentage changes over small spans of time. The data comes from yahoo finance and is downloaded in CSV format. Our visualization will be a treemap, which are ubiquitous in finance.
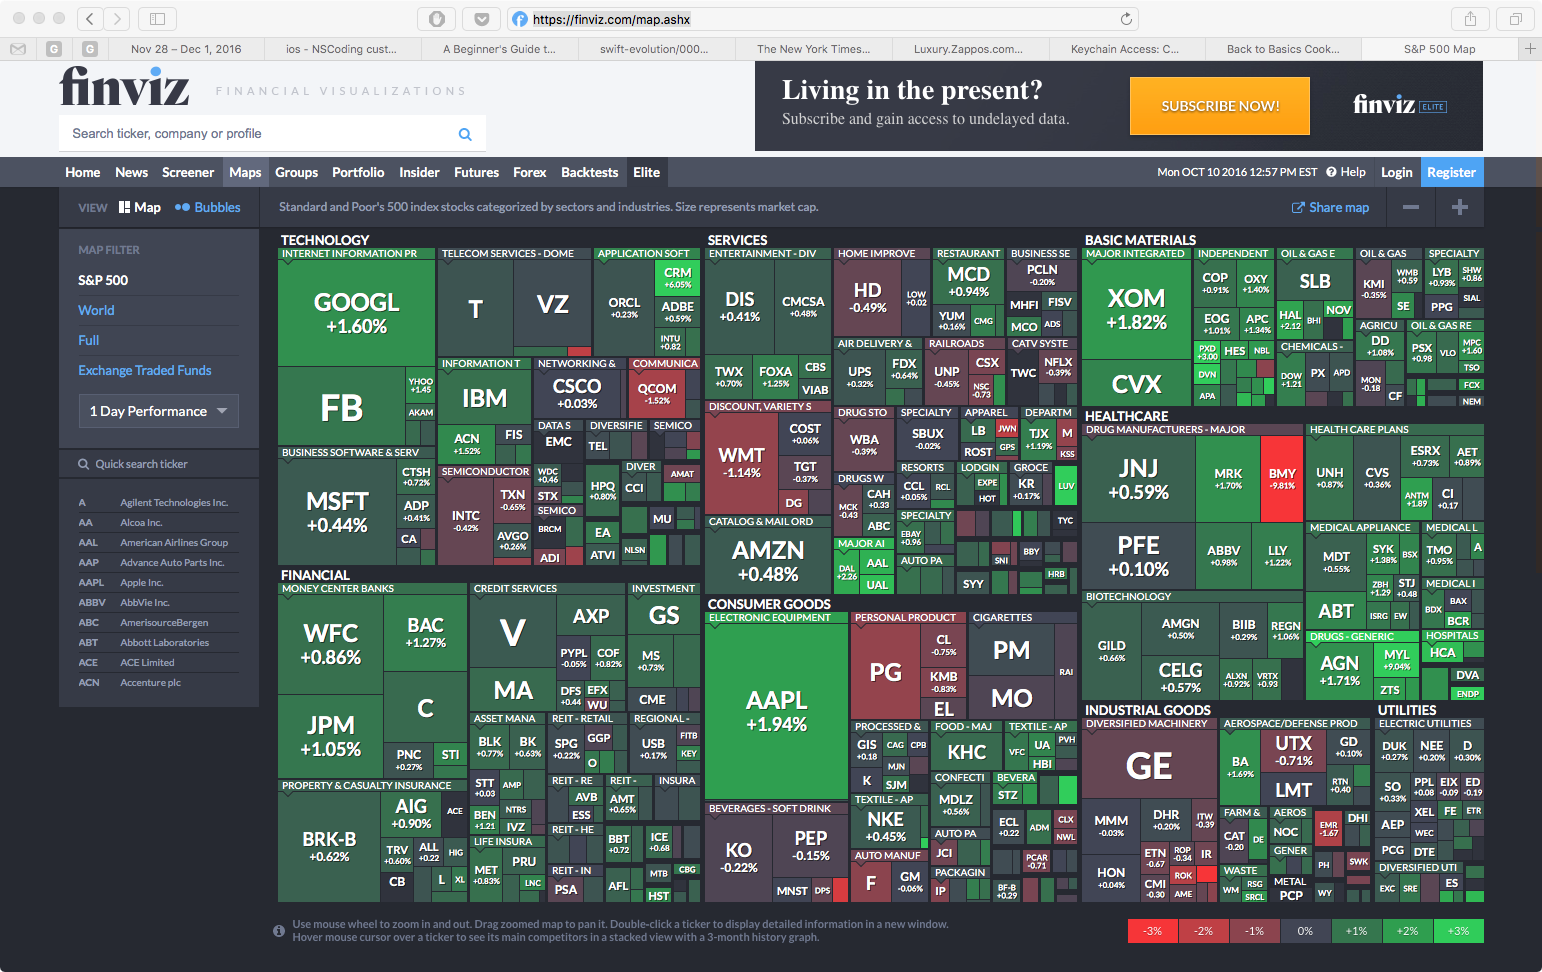
This visualization is based on a binary tree. We will reproduce something similar, starting from scratch.
Step 0: Lab Preparation
- Please review Lectures 13 and 14 and 15.
- Git Branches
- For reference, read How to Download Shareprice Data in CSV on Yahoo Finance
Step 1: Source Code
- Clone your private repo to an appropriate directory in your home folder
(
~/labsis a good choice)$ git clone https://github.com/<git-username>/lab5.git
Remember, you can always get the repo address by using the https copy-to-clipboard link on github. - Once inside your <git-username>-lab5 directory, create a virtual environment using
$ virtualenv -p python3 venv
- Activate your environment by typing:
$ . venv/bin/activate
- Use pip to install the pillows imaging library:
$ pip install pillow
- Use pip to install the requests HTTP library:
$ pip install requests
- Remember that you must always activate your virtual environment when opening a new terminal
- Type
$ git branch
and notice that you are currently editing the master branch. - Create a new branch with
$ git branch viz
- Checkout this branch by typing
$ git checkout viz
- Any changes you make to the repository are now isolated on this branch.
Step 2: Grabbing Data
The file fetch.py contains skeleton code to download a CSV file containing stock symbols, market capitalization, and price change percentages over a 50 day moving average. Here is how it works.
- The function
nasdaq_top_100grabs some CSV information about the NASDAQ 100 stocks using therequestslibrary, parses it, and returns a list of stock symbols. This function is provided. - The function
from_urltakes a list of stock symbols and constructs a URL to download symbol, market cap, and percentage change data in CSV format. Here is an example URL to grab information about Apple, Google, and Facebook. The f parameter in the URL asks for data about the stock symbol (s), the market cap (j1) and the percentage change in the 50-day moving average (m8)http://download.finance.yahoo.com/d/quotes.csv?s=AAPL,GOOG,FB&f=sj1m8
You need to write the function so it returns the appropriately formatted URL. In other words, you'll return the above string, but with the correct stock symbols inserted and formatted properly. - The
mainfunction is provided. It grabs the CSV file from the URL that you built and prints it to striaght to standard out. - Running
$ python3 fetch.py
will print out this data in CSV format to the terminal. You can (and should) redirect this output to a file by typing$ python3 fetch.py > data.csv
- The first few lines of the data should look similar to this:
	"ATVI",32.65B,+2.205%
	"ADBE",54.36B,+5.32%
	"AKAM",9.68B,+3.79%
Step 3: Scrubbing Data
-
The file
stocks.pycontains a function calledstock_info_fromthat takes a filename for a file in CSV format and returns a list of stocks where each Stock is an instance of aStockthat contains a stock symbol, market cap, and percentage increase. - You should start by defining a simple
Stockclass with three member variablessymbol,cap, andchange. Use Lecture 13 as a guide. - Now implement
stock_info_from. You should open the file using thewithsyntax and make use of acsv.readerto parse the CSV - You will need to massage the market cap and percentage
data as described in the docstring. You might find it helpful
to define three helper functions inside the definition
of
stock_info_from:to_billion(s), which converts a string of the form XX.XXB into an appropriately sized integer, andto_float(s), which converts a string of the form [+,-]XXX.X% and returns floating point number representing the rate (i.e., 25.2% becomes .252), and
row_to_stock, which converts a row returned by the CSV reader (i.e., a list of three strings) into a stock
def stock_info_from(file):
    """
    Takes a CSV file of the form

    COMPANY STOCK_SYMBOL, MARKET_CAP, PERCENT_CHANGE_50_DAYS

    where

    STOCK_SYMBOL is a string
    MARKET_CAP is a string of the form "XX.XXXB" where B = BILLION
    PERCENT_CHANGE_50_DAYS is a string of the form "[+,-]XXX.X%"

    and returns a list of Stocks

    where

    Stock.symbol is the stock symbol
    Stock.cap is an integer (the actuall billion dollar number) and
    Stock.change is is a float where -20.5%  is -0.205

    """

    def to_billion(s):

    def to_float(s):

    def row_to_stock(row):
Make sure to test your function out from the Python REPL. Your data should look similar to the following.
  >>> import stocks
  >>> stocks.stock_info_from("data.csv")
  [Stock(ATVI, 32650000000, 0.02205), Stock(ADBE, 54360000000, 0.053200000000000004), ..., ]
  >>>
Step 4: Making Rectangles
Recall from lecture how we could view the tree produced
from build_treemap as partitioning the unit square
into a series of rectangles that collectively tile the square.
Our goal in this step is to write a
function generate_rects that when given a
Tree tree, a Rectangle rect, and an
orientation (either 'H' or 'V')
returns the tiling list of rectangles.
This function will be similar to
the inorder_leaves method of the tree class. It
will recusively construct a list of rectangles that correspond
to the partition of the unit square induced by the tree.
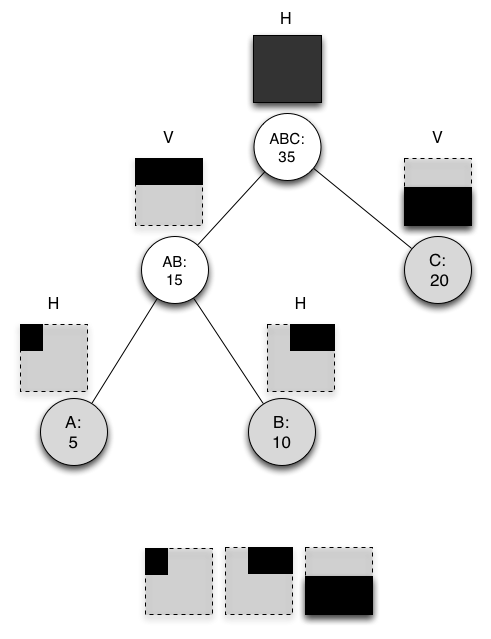
Each level of the recursion splits the given rectangle along the
given orientation according to the weights of its left and right
children. Consider the figure below where the grey nodes
correspond to leaves of the tree (i.e., stocks) with
corresponding caps. You can view the rectangle generation
process as starting at the top with the rectangle in all black,
and splitting that rectangle into two rectangles corresponding
to a 3/7 and 4/7 split along the horizontal axis. This process
continues until you reach a leaf, which yields one of the
rectangles.
- Base Case: Like with
inorder_leaves, if tree is a leaf, then we want to generate a rectangle. In this case, the rectangle we want to generate is the one passed to the function, so we return it in a list. - Inductive Case: If we are at an internal node, then
we need to split the given rectangle into two new rectangles
along the given orientation. You can do this with the
provided
split_rectfunction. Call the first rectangle theleft_rectand the second rectangleright_rect. Now you should make two recursive calls togenerate_rects: one withtree.left,left_rect, and the opposite orientation (i.e. 'V' if 'H' or 'H' if 'V') and one with the symmetric call for the right tree. Both of these recursive calls will return lists of rects, which you can combine and return.
Here is the skeleton code, with the base case filled in.
      def generate_rects(tree, rect=Rectangle(0, 0, 1, 1), orient='H'):
          if tree.leaf():
              return [rect]
          else:
You can test your code with the following
      >>> from stocks import Stock
      >>> from viz import generate_rects
      >>> from tree import build_treemap
      >>> generate_rects(build_treemap([Stock('',5,0), Stock('',10,0), Stock('',20,0)]))
      [Rectangle(0, 0, 0.3333333333333333, 0.42857142857142855), Rectangle(0.3333333333333333, 0, 1, 0.42857142857142855),
       Rectangle(0, 0.42857142857142855, 1, 1)]
      >>>
Step 5: Visualizing Rectangles
The draw_rects function takes an image, a list
of N rectangles that collectively tile the unit square,
and a list of N colors and draws a projection of each
rectangle, filled with the appropriate color, onto the image.
Some notes:
- Image objects have a size attribute that
returns a tuple (width,height) so you can always get
dimesions from the object using
w, h =
      im.size
. - Any point (x,y) of the unit square corresponds to the point (x × width, y × height) in your image. Use this to map your rectangles onto the image appropriately.
- Consider using zip to pair your rectangles with their appropriate colors.
    def draw_rects(im, rects, colors):
        """
        Map and draw rectangles from the unit square onto the image

        :param im: an Image
        :param rects: a list of N rectangles where a rectangle is a pair of points
        :param symbols:  a list of N stock symbols corresponding to the N rectangles"""
Step 6: Putting it all Together
The function draw should perform the following:
- Create a
Treeusing thebuild_treemapfunction from thetreemodule. - Use the
inorder_leavesof the tree to create a list of the N stocks in an order corresponding to the leaves of the tree. - Generate N rectangles
using
generate_rectsfunction. These rectangles collectively tile the unit square and are ordered to correspond to the stocks in the leaves of the tree. - Generate a list of N colors using
the
create_colorfunction, which is provided. Consider using a list comprehension here that iterates over the stocks corresponding to the leaves of the tree. - Use
draw_rectsand thendraw_symbolsto create the final image. - No need to return anything because
drawis side-effecting the image passed as an argument.
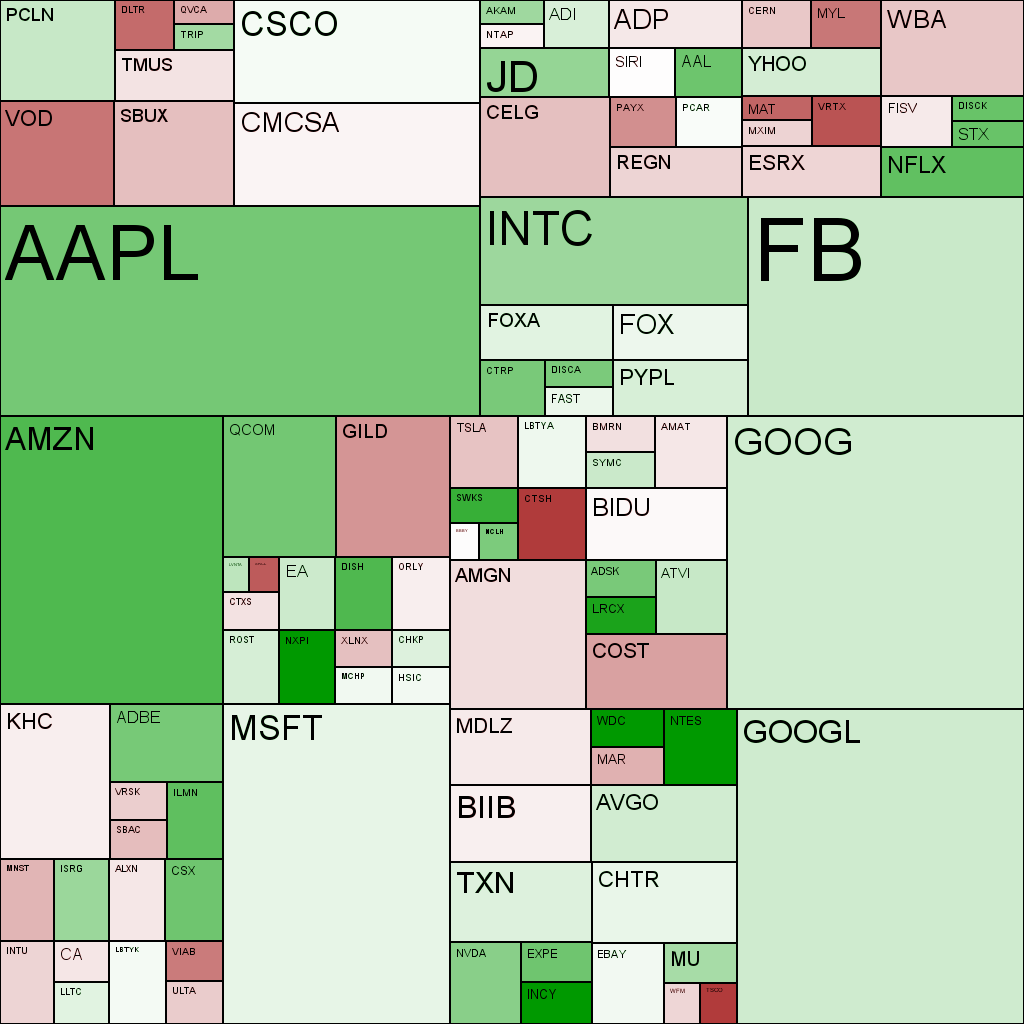
To run your code from the command line use
$ python viz.py data.csv stocks.png 1024 1024
Your visualization should look like this.
Step 7: Submission
- Now commit those additions to the repository:
$ git commit -a -m "some log message"
- Push your changes back to github repo:
$ git push
You will probably be asked to type$ git push --set-upstream origin vizwhich you should do. This pushes your viz branch back up to the GitHub Repo. - Now navigate to your GitHub repo using a web browser. You should see a list of recently pushed branches with links to compare and pull request. Go ahead and issue a PR